FIGURE 3.
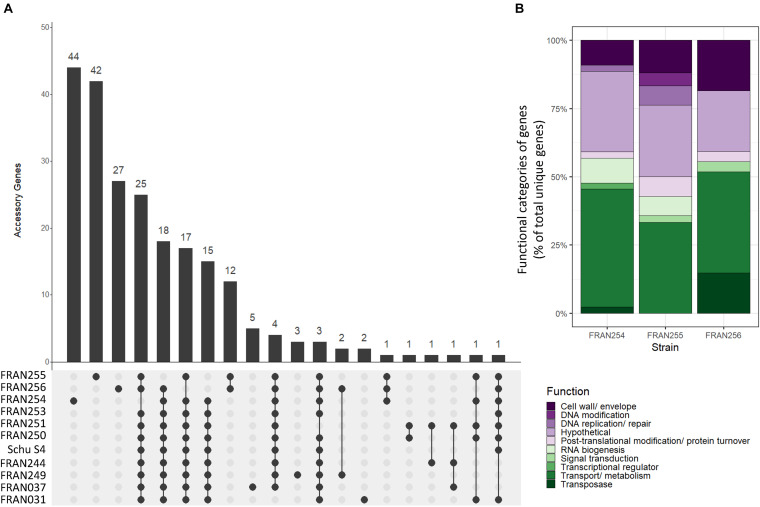
UpSet plots based on gene conservation across the F. tularensis panel. (A) UpSet plots show the intersections of gene groups among all strains. Strains are indicated in the rows, while intersections are shown in the columns. Filled circles indicate the presence of a specific subset of genes within that strain while empty circles indicate absence of the gene set within a strain. The bar graph above shows the size of each gene group intersection. For example, the first bar shows 44 genes that are unique in FRAN254, since the only filled circle corresponds to FRAN254; however, the fourth bar indicates a set of 25 genes that are conserved in all strains with the exception of FRAN254. (B) Stacked bar chart showing gene groups unique to FRAN254, FRAN255, and FRAN256, with colored bars indicating the functional categories assigned to each gene as a percent of the total genes.

