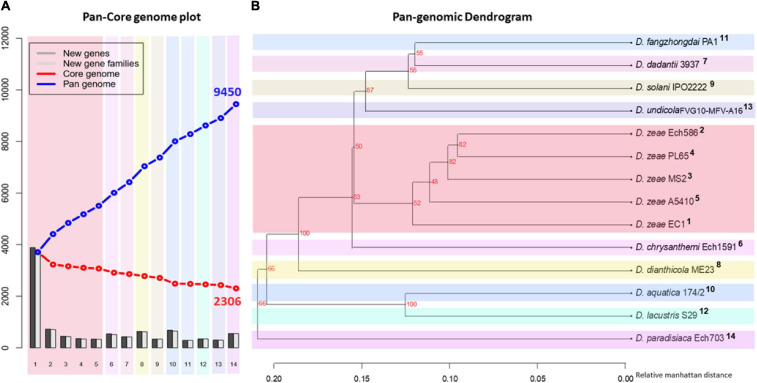
FIGURE 4.
Pan- and core-genome analyses among the Dickeya species. Pan- and core-genome plot: (A) The pan and core genome analyses were developed by employing BLAST with a cutoff of 50% identity and 50% coverage of the longest gene. (B) Pan-genome tree: the respective dendrogram illustrates the grouping of species based upon the shared gene families (core genome) defined in the pan- and core-genome analysis. Organisms are marked 1–14; 1, PL65; 2, A5410; 3, MS2; 4, Ech586; 5, EC1 (D. zeae); 6, D. undicola FVG10-MFV-A16; 7, D. aquatica 174/2; 8, D. lacustris S29; 9, D. solani IPO 2222; 10, D. dadantii 3937; 11, D. dianthicola ME23; 12, D. fangzhongdai PA1; 13, D. paradisiaca Ech703; and 14, D. chrysanthemi Ech1591.

