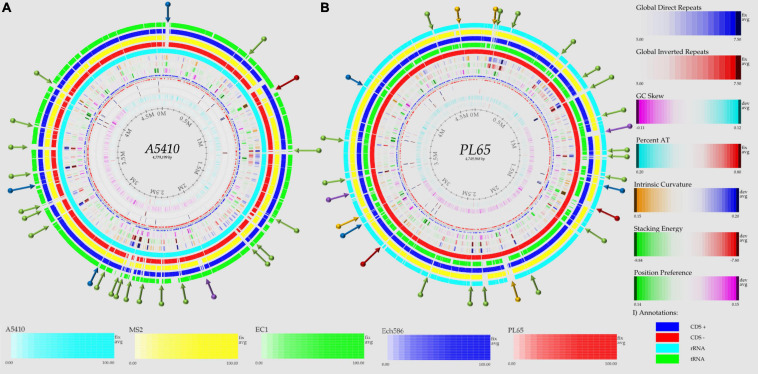
FIGURE 5.
Genome BLAST atlases within the D. zeae complex species. The genomes of novel strains (A) A5410 and (B) PL65 were used as references to generate the circular graphics. Data of DNA, RNA, and gene features of both the references were obtained after annotating the genomes using the NCBI prokaryotic genome annotation pipeline (PGAP). From the most inward lane, the figures display the size of the genome (axis), percent AT (red = high AT), GC skew (blue = most Gs), inverted and direct repeats (DRs; color = repeat), a position preference, stacking energy, and an intrinsic curvature. Following these layers, the external solid rings (indicated with a unique color) represent the genomes of other D. zeae strains mapped against the references. Olive arrows highlight those unique DNA regions associated with a high intrinsic curvature, stacking energy and a position reference found solely in the novel strains A5410 and PL65. Dark-red arrows pinpoint the areas of the genome with a low intrinsic curvature, stacking energy, and a position reference. Dark-blue arrows indicate a low intrinsic curvature and low stacking energy but a high position reference. Orange arrows show areas of the genome displaying a high intrinsic curvature and high stacking energy but a low position reference, whereas purple arrows represent those genetic zones absent in some D. zeae isolates. BLAST genome atlases were created using the CMG-biotools pipeline.

