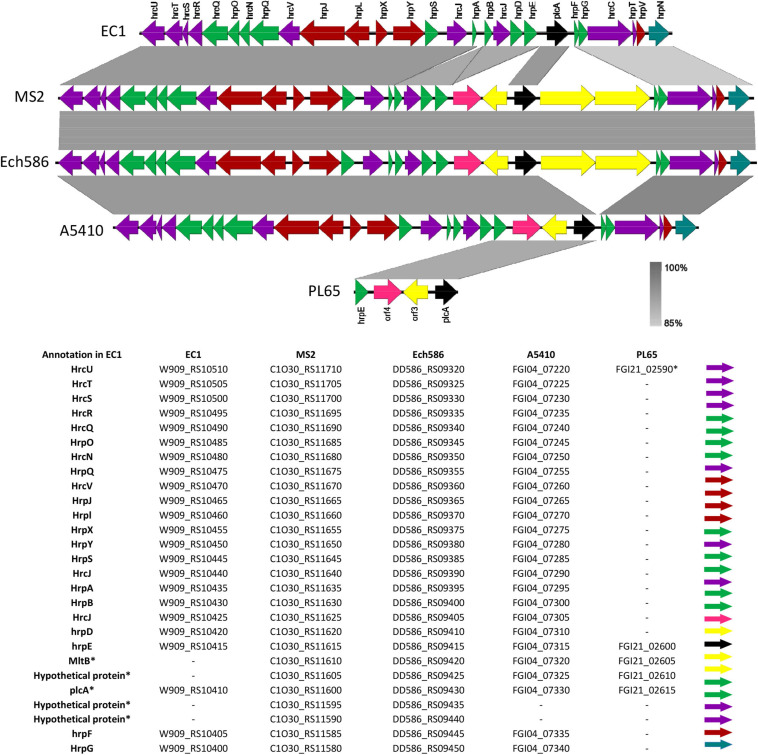
FIGURE 9.
Comparison of the genetic organization of type III secretion system (T3SS) among five D. zeae strains. The arrow position represented a forward/reverse gene orientation. The arrow color signified a specific gene composition within the T3SS. A pairwise alignment between the linear sequences was rendered based upon the BLAST algorithm with cut-off values from 85 to 100%. Regions with a higher nucleotide identity were displayed with a shaded gray.

