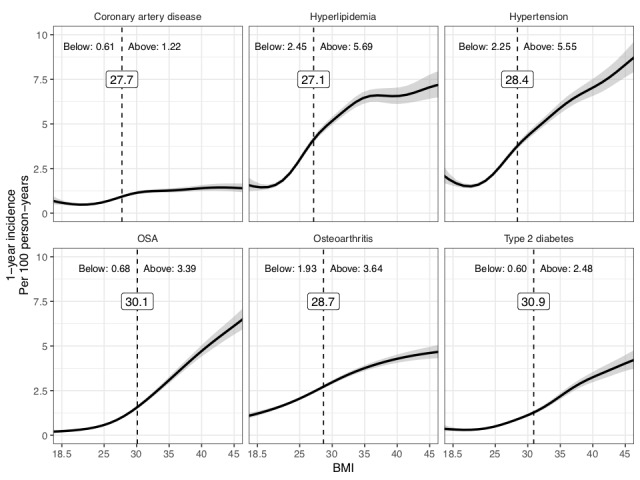
Figure 2.

Cut points and comorbidity incidence. Gray shaded areas represent 95% CIs. The dotted line and the values in the box represent BMI cut points. "Below" corresponds to overall disease incidence (per 100 person-years) for all patients with a BMI that is less than the cut point. "Above" corresponds to overall disease incidence (per 100 person-years) for all patients with a BMI that is greater than the cut point. OSA: obstructive sleep apnea.
