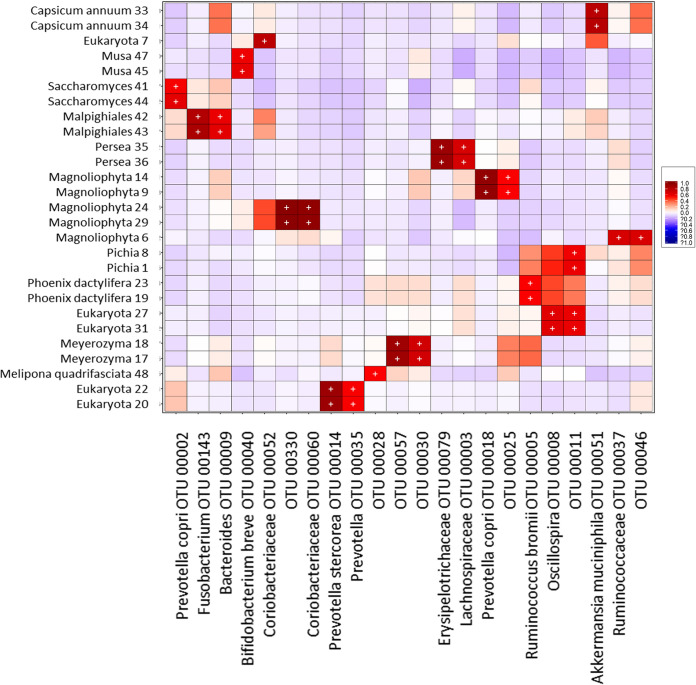
FIG 8.
Heat map of biweight correlations (Pearson) between the top 50 bacterial (x axis) and the top 50 eukaryote (y axis) taxon OTUs in fecal samples of weaned children (>1 year old) and mothers. Colors denote positive (red) and negative (blue) correlation values. Significant correlations are denoted with a plus sign (P < 0.05 [FDR]).

