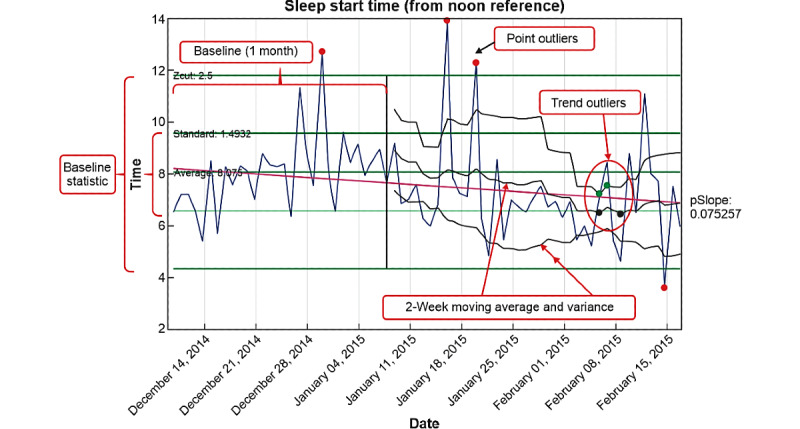
Figure 2.

Sleep onset time for a single relapse patient. Outliers and trends may have causal explanations other than relapse but allow an opportunity to have conversations about behaviors with objective data. The first month was used to establish baseline normal data. Outlier alerts can be set based on baseline mean and variance. In this case, outlier detection alerts were set at 2.5 SDs from the baseline population distribution. After the baseline, a moving average window of 2 weeks was calculated and overlayed on daily data and was used to look for significant changes or trends from the baseline mean or variance. Finally, statistically relevant changes in the slope over a defined interval can indicate relevant changes. The flagged points represent outliers or changes above a set threshold. Flags noted on the moving average mean indicate significant differences for the moving average mean, and flags noted on the moving average variance indicate significant differences in variance from the baseline. For example, examining the sleep onset data, there is a significant trend toward earlier sleep times as the patient approached relapse. The average sleep onset time at baseline was 8 PM. Near relapse, the data had trended to a 2-week average around 6:30 PM.
