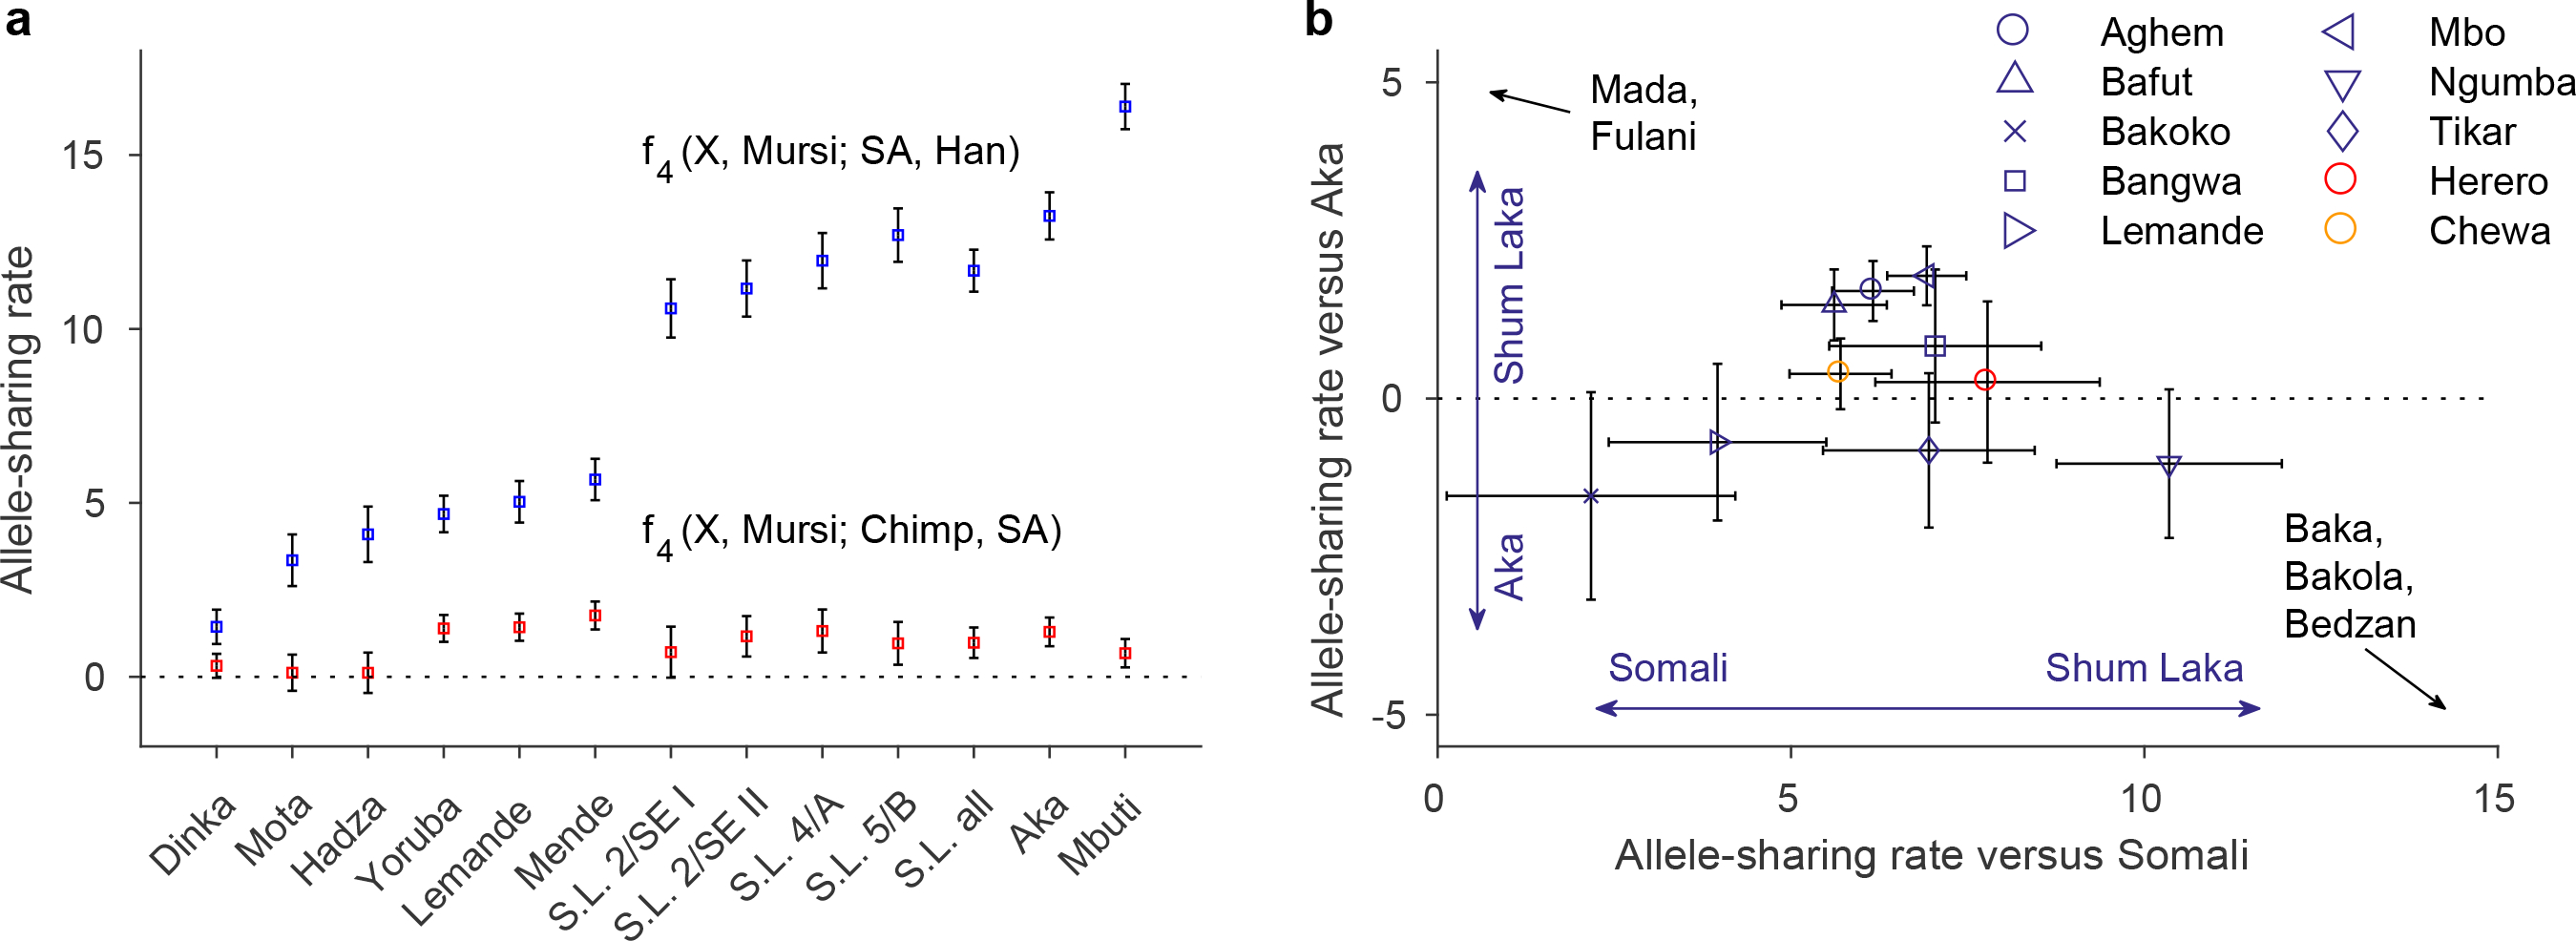
Figure 3: Allele-sharing statistics.

(A) Statistics sensitive to deep ancestry (mean ± 2SE, multiplied by 1000; blue, deeper than non-Africans; red, deeper than South African hunter-gatherers; computed on 1,121,119 SNPs). S.L., Shum Laka; SA, ancient South African hunter-gatherers. (B) Relative allele sharing (mean ± SE, multiplied by 10,000; computed on 538,133 SNPs) with Shum Laka versus East Africans (f4(X, Yoruba; Shum Laka, Somali); x-axis) and versus Aka (f4 (X, Yoruba; Shum Laka, Aka); y-axis) for present-day populations from Cameroon (blue) and southern (Herero, red) and eastern (Chewa, orange) Bantu speakers. See also Extended Data Fig. 3B.
