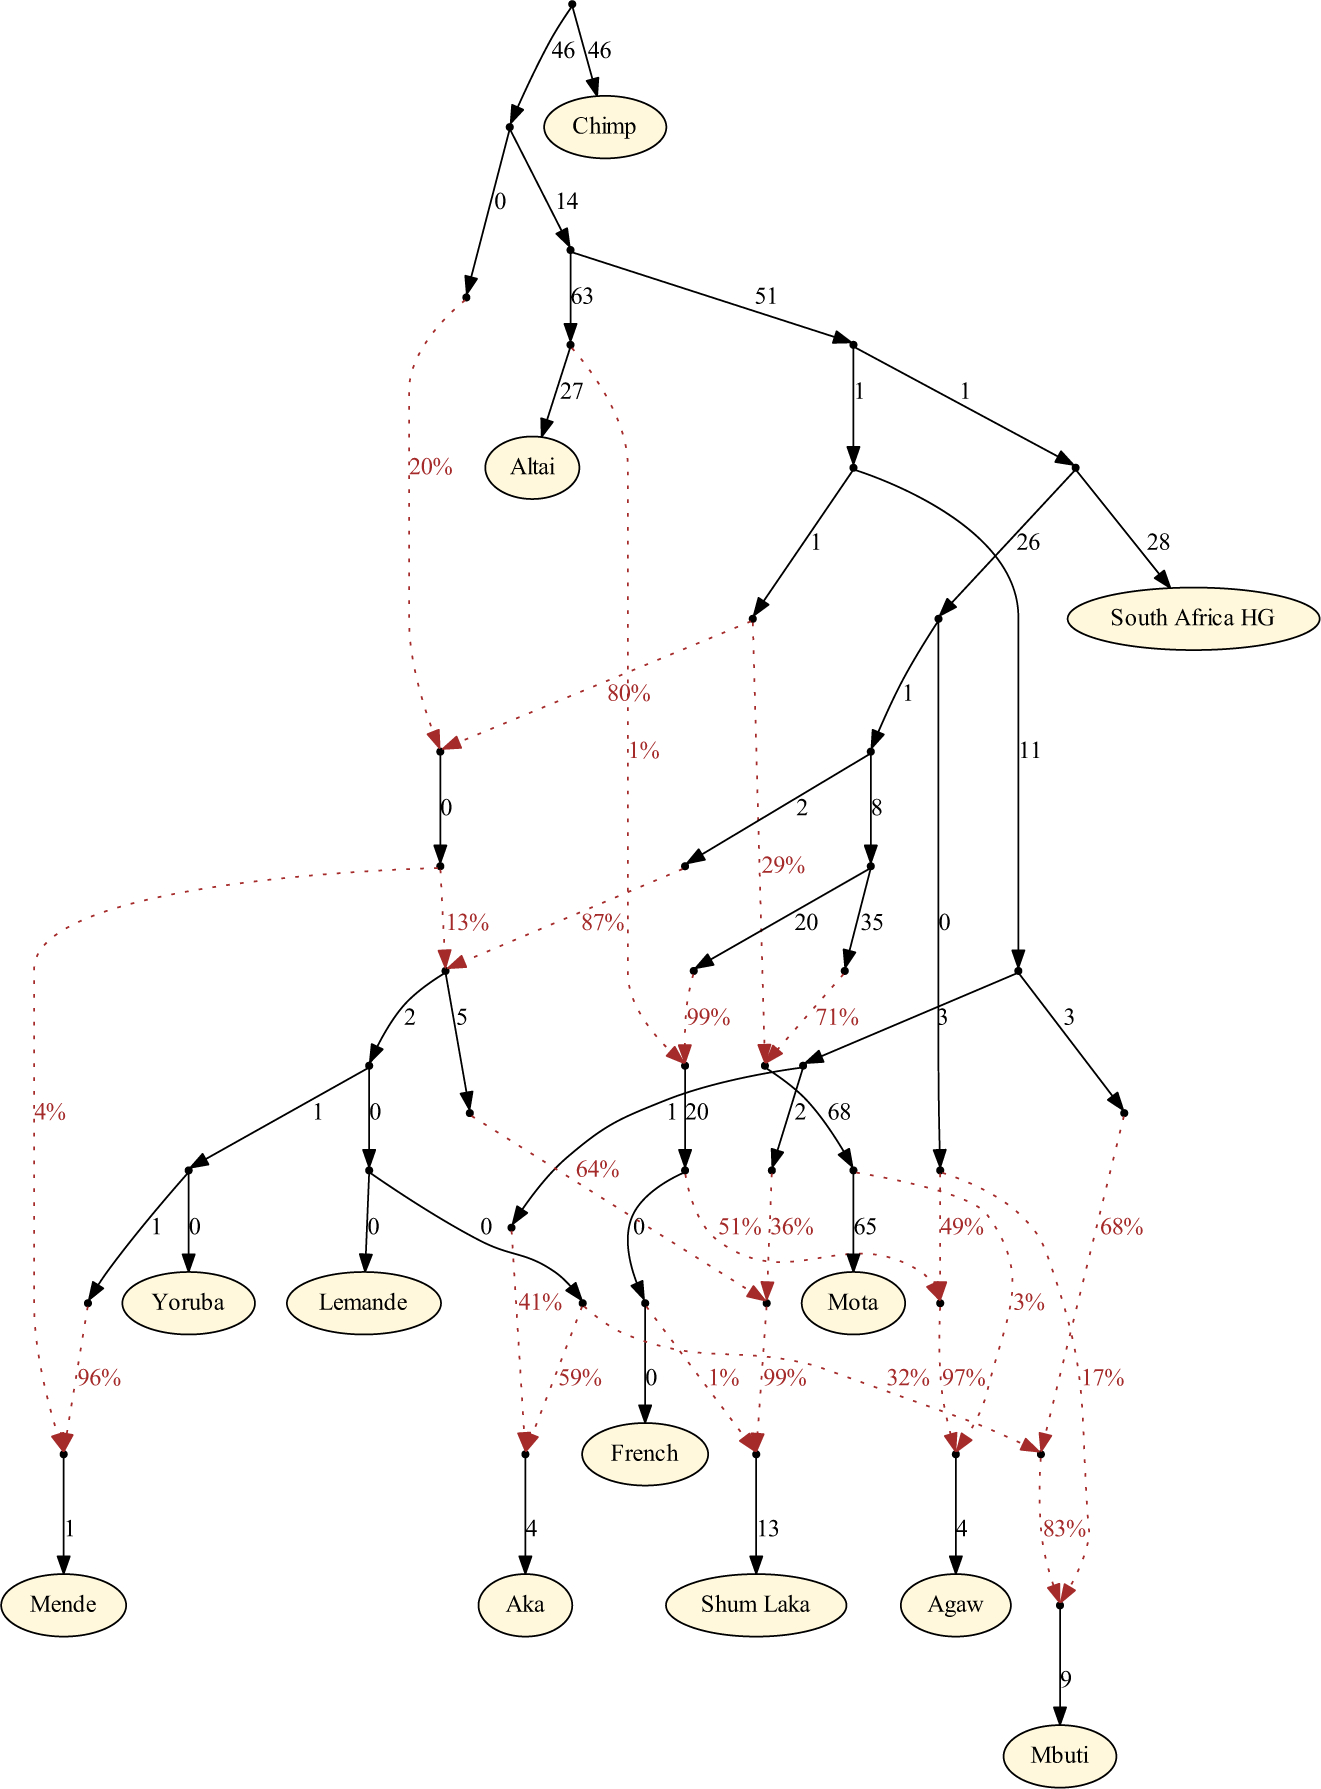
Extended Data Figure 4: Primary inferred admixture graph with full parameters.

Of the ∼1.2M targeted SNPs, 932k are used for fitting (i.e., are covered by all populations in the model). Branch lengths (in units of squared allele frequency divergence) are rounded to the nearest integer. All f-statistics relating the populations are predicted to within 2.3 standard errors of their observed values.
