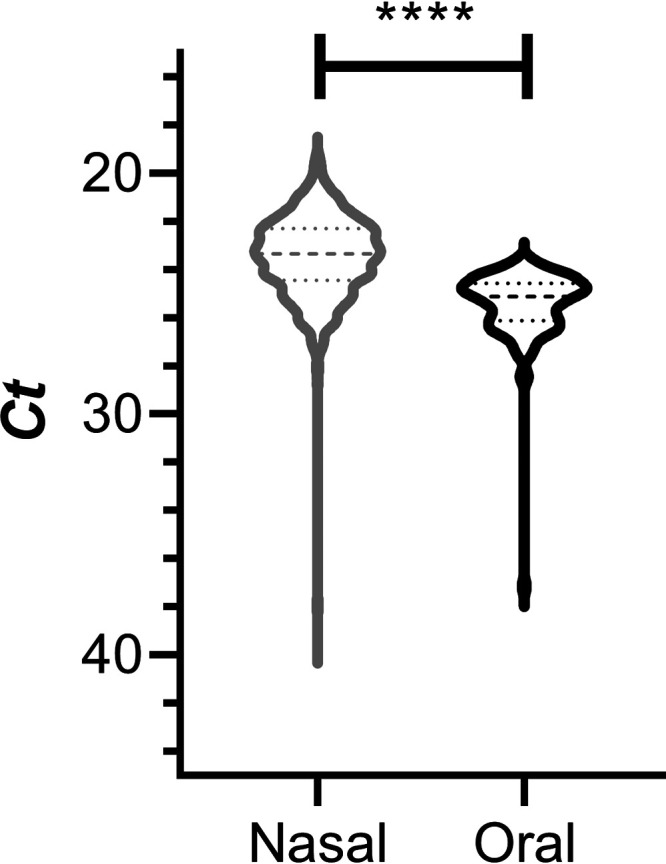
FIG 1.

Distribution of RP gene transcript CT values over the 3-month clinical study. Shown is a violin plot comparing the CT values for nasal (gray) and oral (black) swab samples. Broken horizontal lines represent medians (dashed) and quartiles (dotted). Comparison of the nasal and oral swab group CT values using an unpaired, parametric, two-tailed t test showed that the groups were significantly different (****, P < 0.0001).
