
FIG 1.
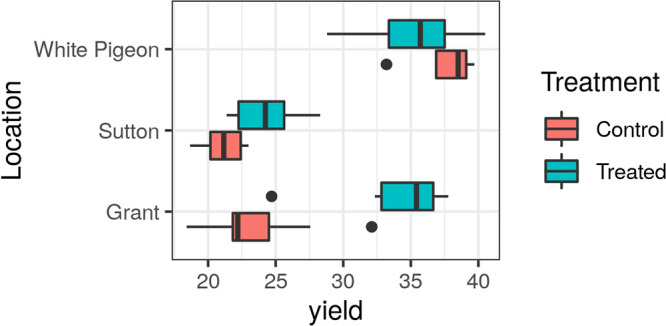
Yield data (t/ha) for control and treated blocks across locations. Yield = 30 separates blocks into two categorical variables (≤30 t/ha, >30 t/ha) and corresponds to one of the natural zero-probability density points in the bimodal yield distribution. The box limits correspond to the 25th and 75th percentiles, and the central line is the median. The whiskers are the 5th and 95th percentiles. The dots represent outliers [points below 25th percentile − (1.5 × IQR) and above 75th percentile + (1.5 × IQR), where IQR is the interquartile range or absolute difference between 75th and 25th percentiles].