FIG 1.

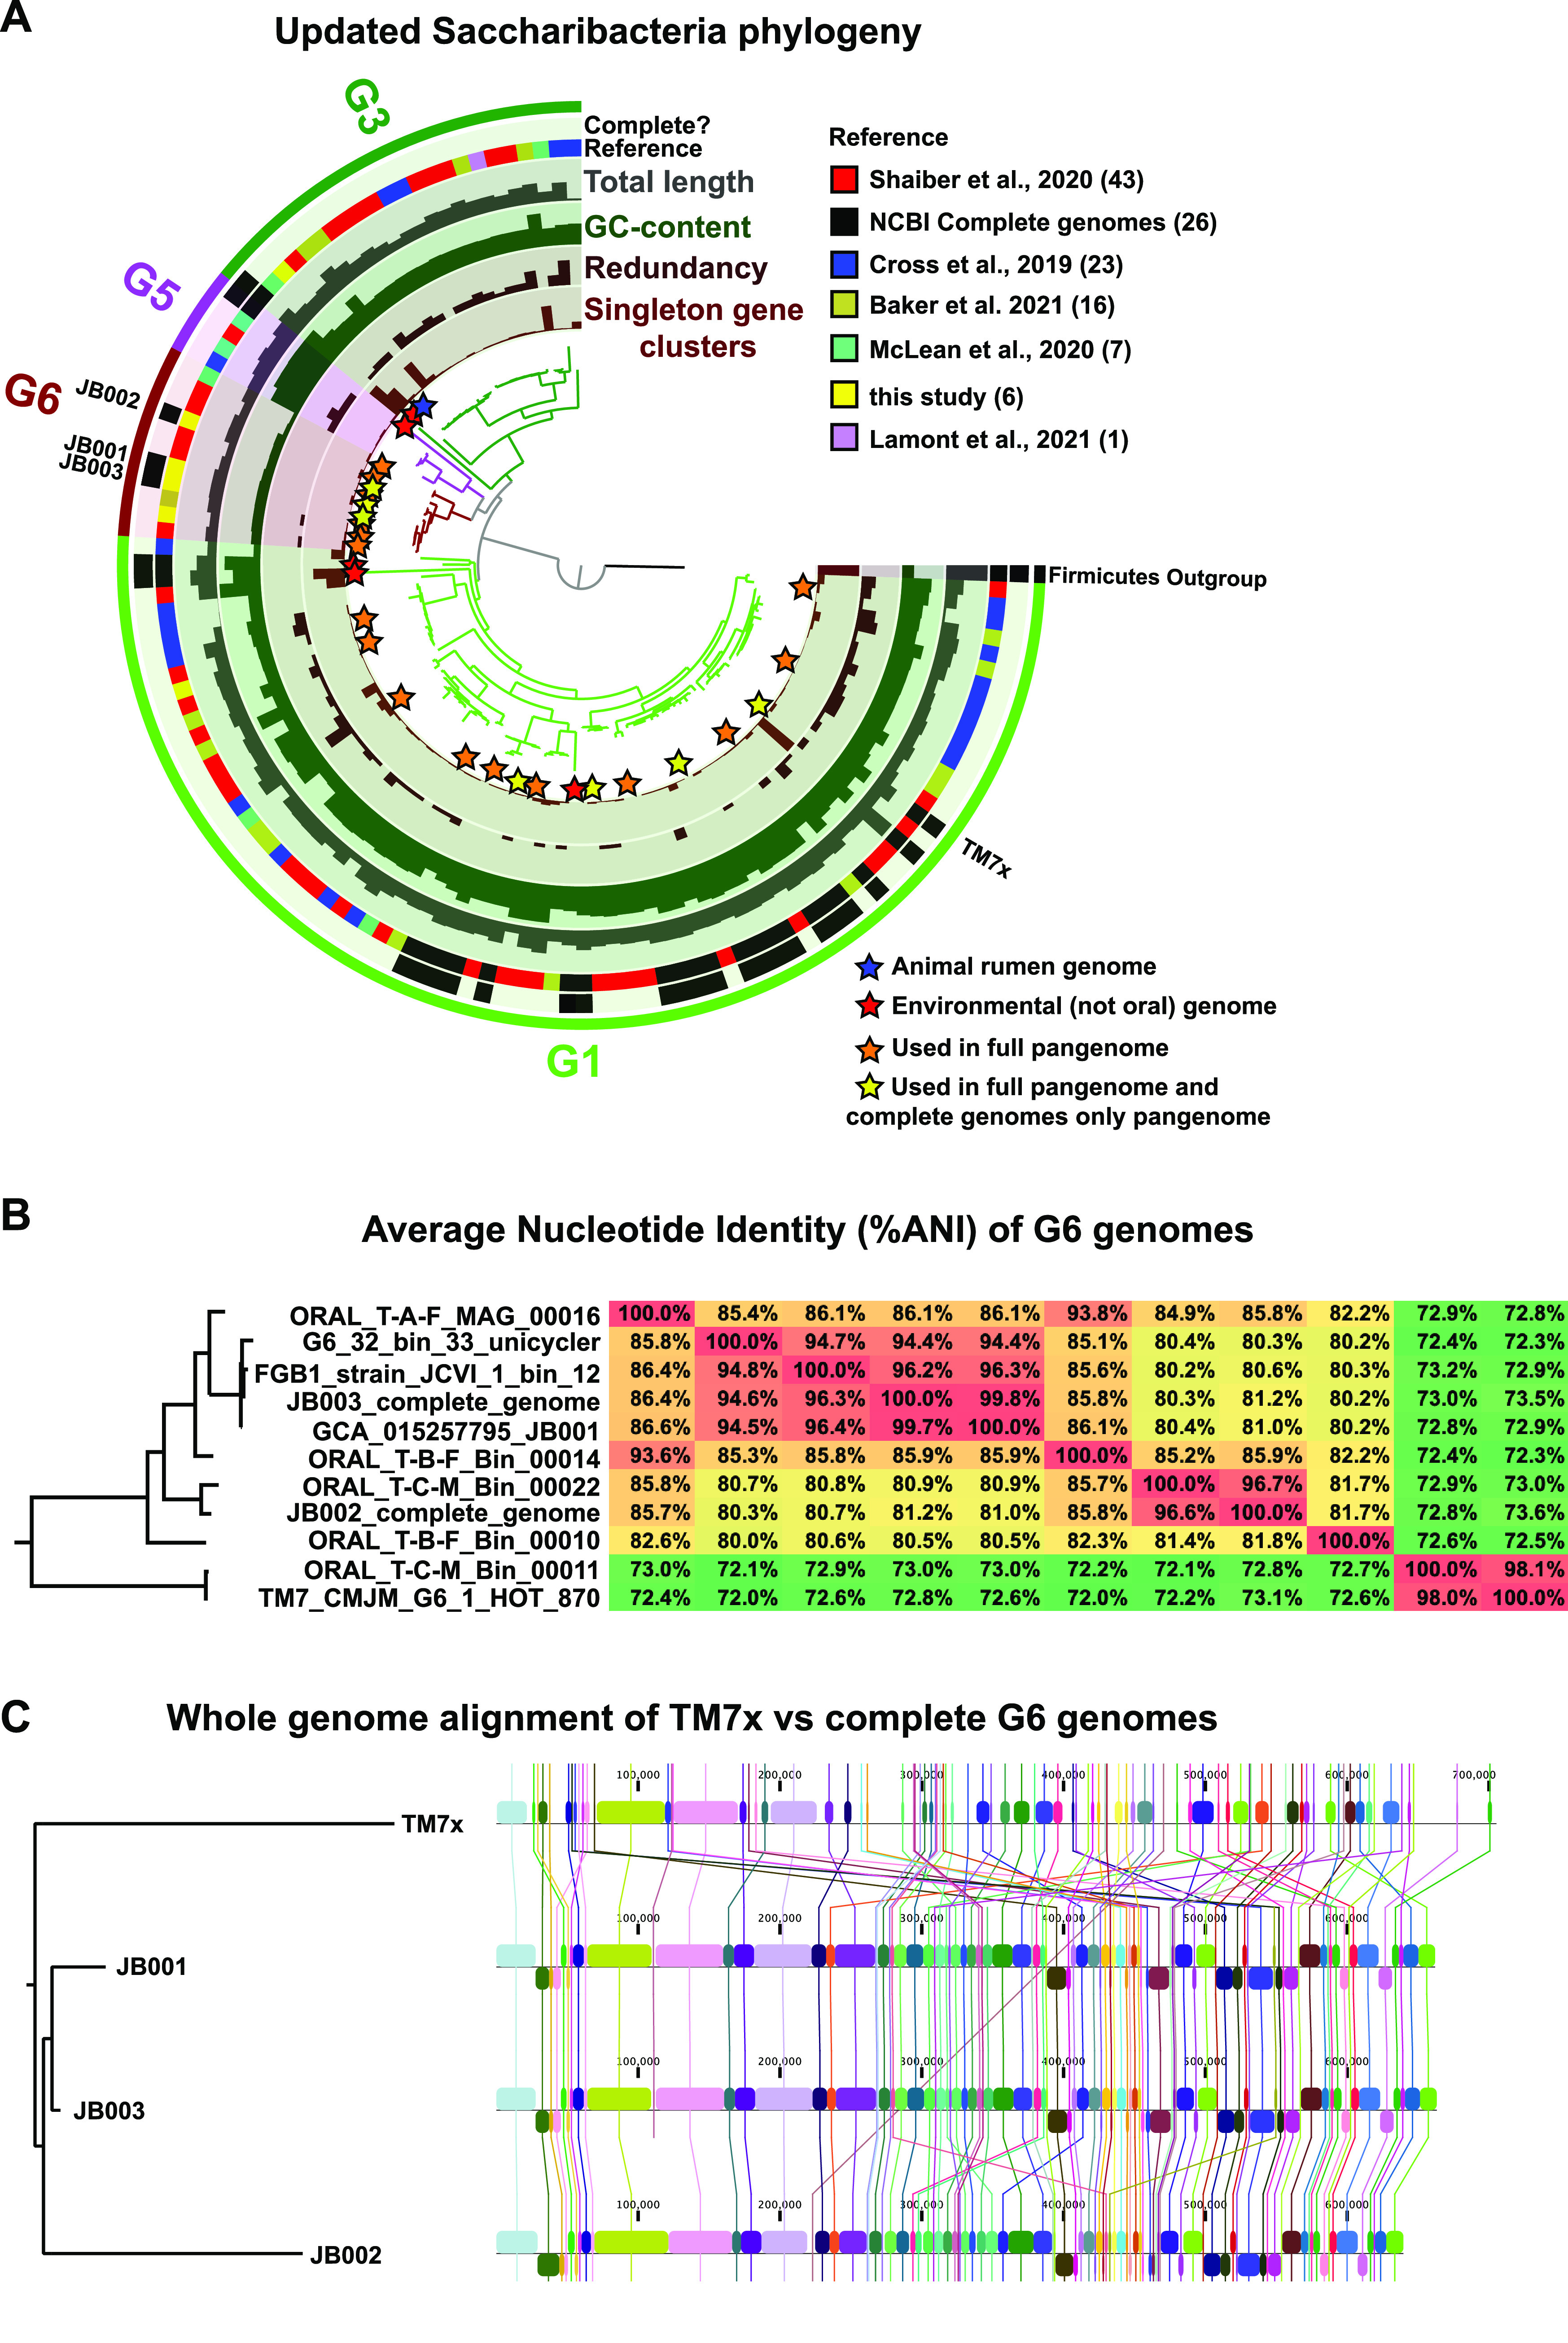
JB001, JB002, and JB003 are clade G6 Saccharibacteria representing two distinct species. (A) Phylogenetic tree of Saccharibacteria annotated with genome data. Phylogenetic analysis of the 123 Saccharibacteria genomes listed in Table S1 in the supplemental material. Firmicutes was used as an outgroup. The bars in the innermost layer represent the number of singleton gene clusters (i.e., genes appearing in only that one genome) in each genome. The bars in the second layer represent the redundancy (likely contamination) within each genome. The bars in the third layer represent the %GC content of each genome. The bars in the fourth layer represent the total length in base pairs of each genome. The fifth layer displays the source/reference for each genome. The sixth layer displays the genomes that are complete. The outermost layer, and the color of the branches of the tree, illustrate which Saccharibacteria clade each genome is part of. Orange stars indicate genomes that were used in the full pangenome analysis (Fig. S2; Table S4). Yellow stars indicate genomes that were used in the pangenome analysis of compete genomes only (Fig. 2; Table S3) as well as the full pangenome analysis (Fig. S2; Table S4). A larger version of this figure, with the name of each genome labeled, is available in Fig. S1. Note that CP025011_1_Candidatus_Saccharibacteria_bacterium_YM_S32_TM7_50_20_chromosome_complete_genome and c_000000000001 (GCA_003516025.1_ASM351602v1_genomic.fa), the only two complete genomes in clades G3 and G5, are from environmental, not oral, samples. The raw data in the annotations of the tree are available in Table S1. A blue star indicates the genome isolated from a mammalian rumen, and red stars indicate genomes that were isolated from environmental sources. All other genomes are from human oral samples. (B) Average nucleotide identity (%ANI) of G6 genomes. Heat map of all-versus-all comparison of %ANI of all 11 G6 genomes. The tree on the right is a scaled-up version of the G6 portion of the phylogenetic tree in panel A. Full percentage identity, which takes alignment length into account, is available in Table S2. (C) Whole-genome alignment of TM7x versus complete G6 genomes. The tree on the left is based on the whole-genome alignment itself.
