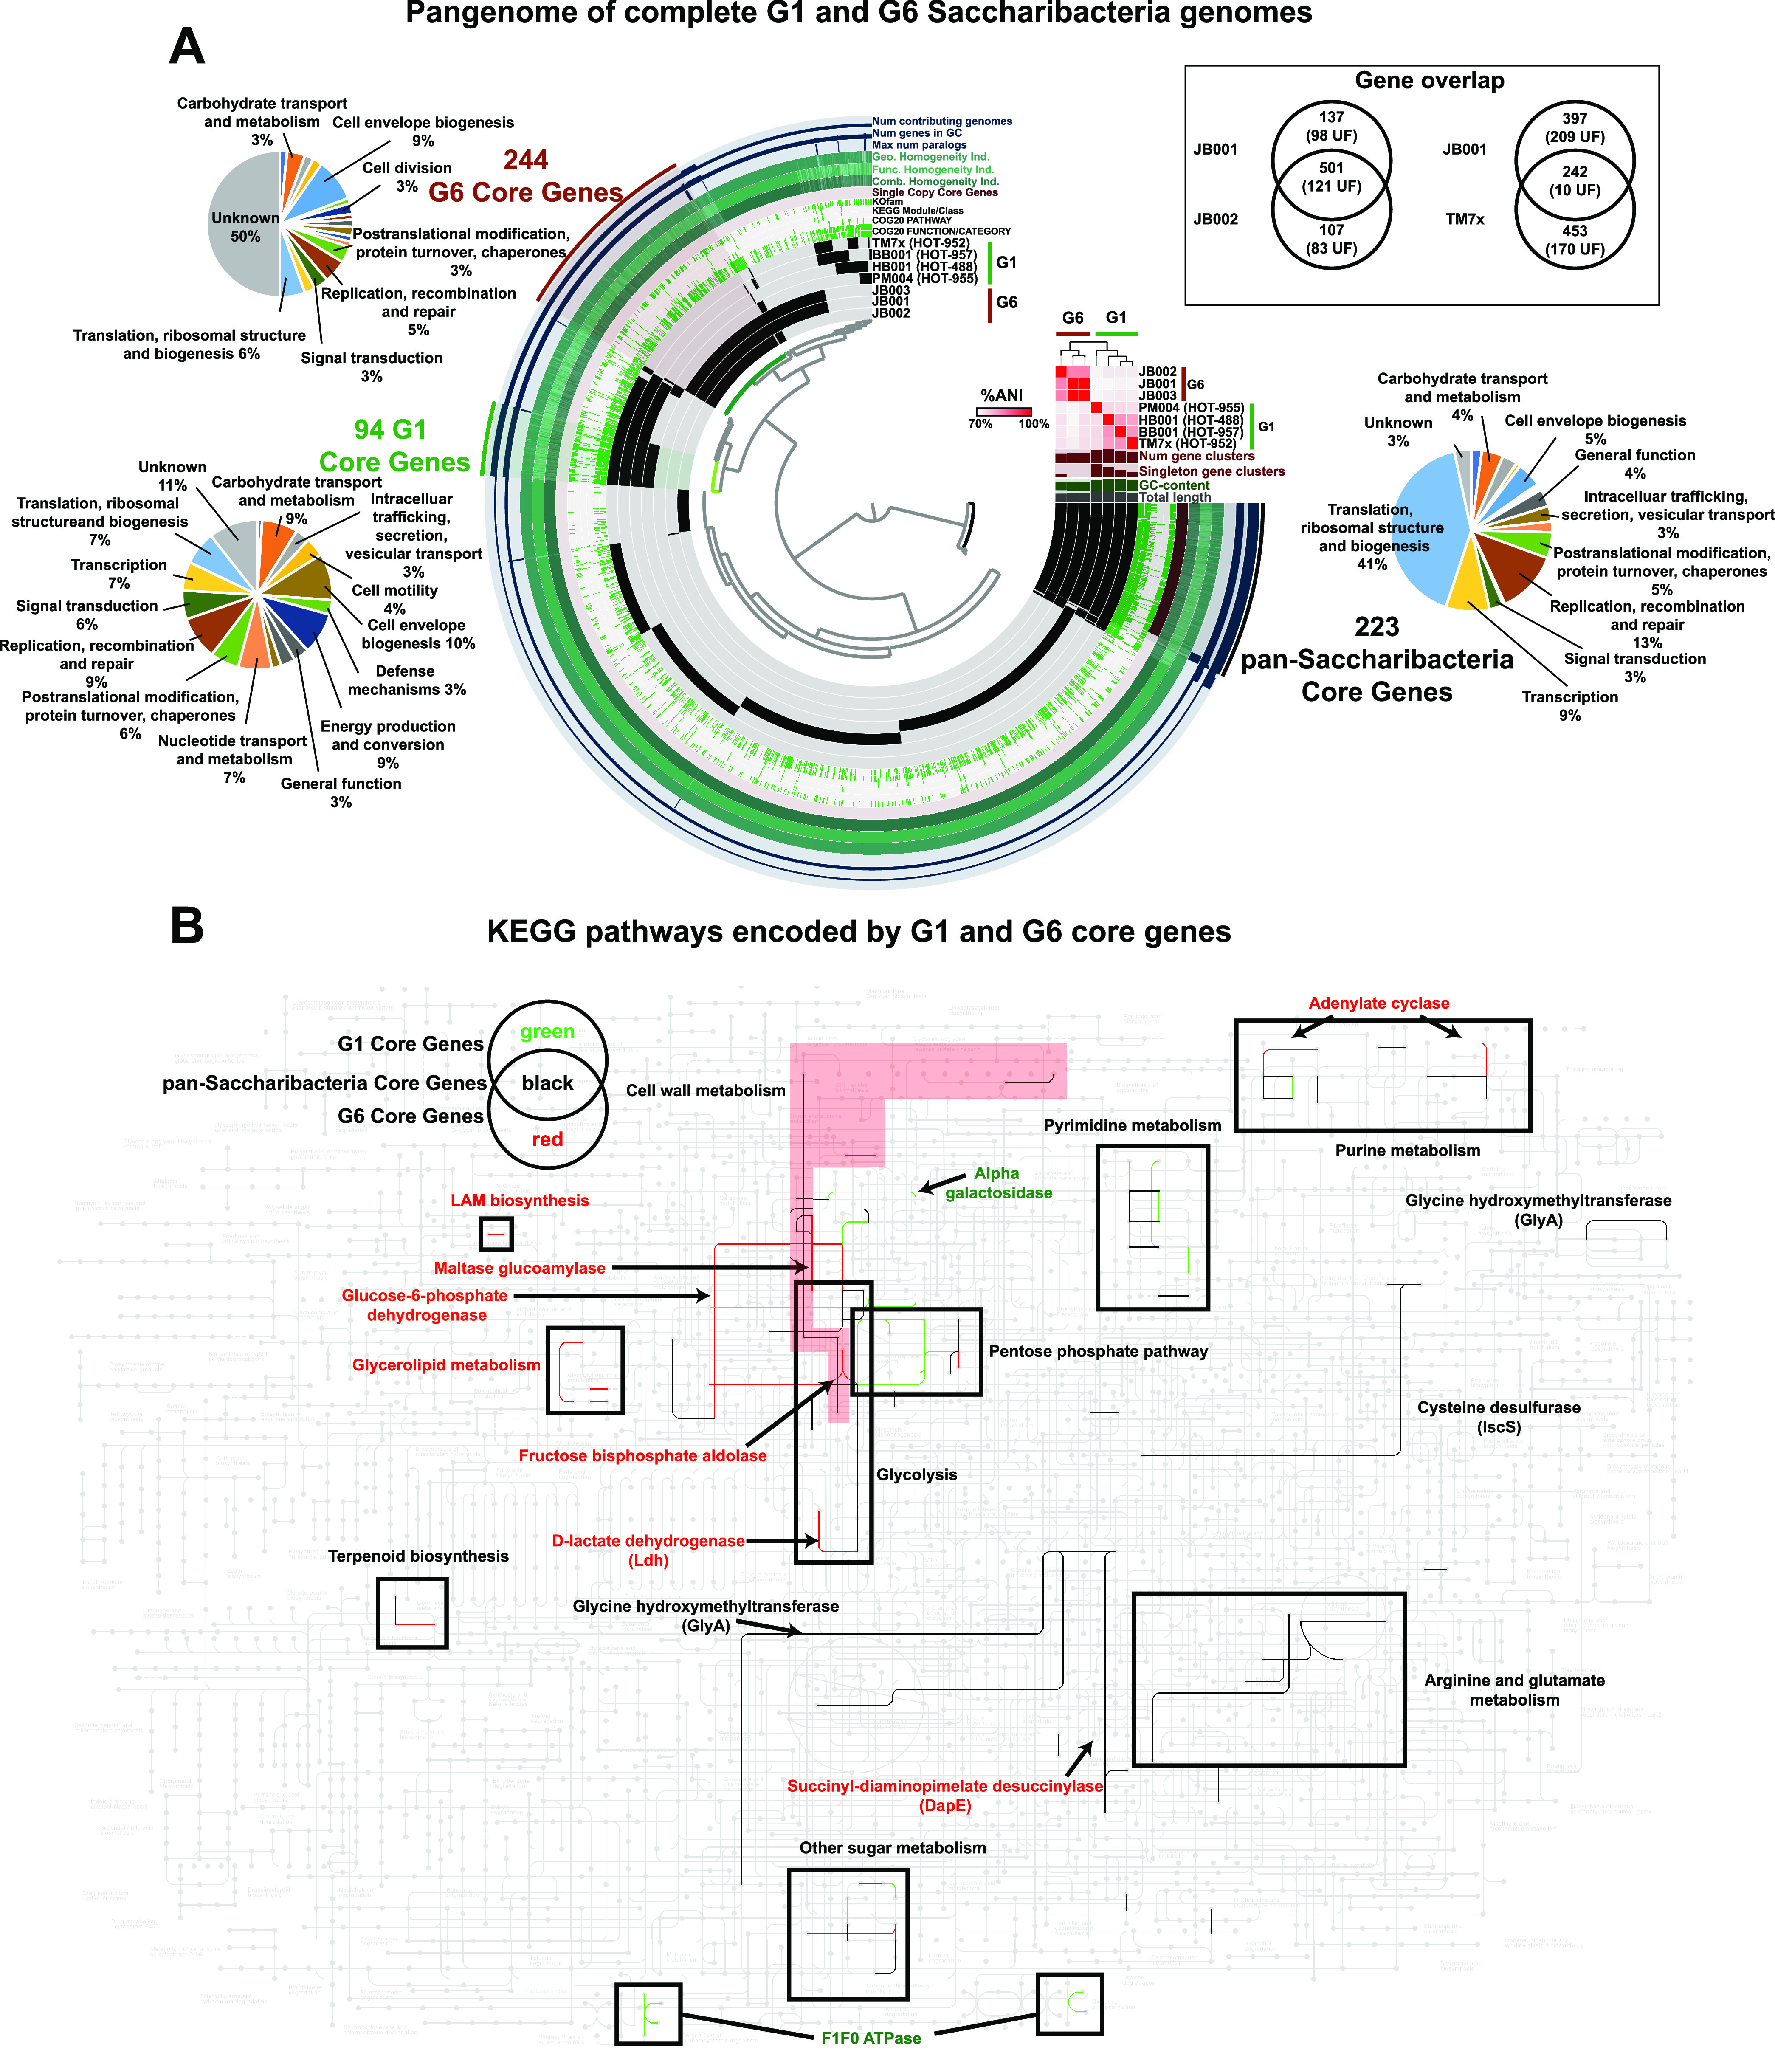
FIG 2.

Pangenome analysis of complete genomes in Saccharibacteria clade G1 versus clade G6 identifies core genes encoding distinct functional pathways. (A) Pangenomes of complete G1 and G6 genomes. The dendrogram in the center organizes the 2,279 gene clusters identified across the genomes represented by the innermost 7 layers: TM7x, BB001, HB001, PM004, JB003, JB001, and JB002. The data points within these 7 layers indicate the presence of a gene cluster in a given genome. From inside to outside, the next 6 layers indicate known versus unknown COG category, COG function, COG pathway, KEGG class, KEGG module, and KOfam. The next layer indicates single-copy pan-Saccharibacteria core genes. The next 6 layers indicate the combined homogeneity index, functional homogeneity index, geometric homogeneity index, maximum number of paralogs, number of genes in the gene cluster, and the number of contributing genomes. The outermost layer highlights gene clusters that correspond to the pan-Saccharibacteria core genes (found in all 7 genomes), the G1 core genes (found in all G1 genomes and no G6 genomes), and the G6 core genes (found in all G6 but no G1 genomes). The pie chart adjacent to each group of core genes indicates the breakdown of COG categories of the gene clusters in the group. The 7 genome layers are ordered based on the tree of the %ANI comparison, which is displayed with the red and white heat map. The layers underneath the %ANI heat map, from top to bottom, indicate the number of gene clusters, the number of singleton gene clusters, the GC content, and the total length of each genome. The Venn diagrams in the inset show the number of overlapping and nonoverlapping genes between JB001 and JB002 and between JB001 and TM7x. The number in parenthesis is the number of genes with unknown functions (UF). (B) KEGG pathways encoded by G1 and G6 core genes. KEGG metabolic map overlaid with the pathways encoded by the pan-Saccharibacteria core genes (black), G1 core genes (green), and G6 core genes (red), as indicated by the Venn diagram key. Enzymes of interest are labeled with text and arrows. Pathways are indicated by labeled boxes; the cell wall metabolism pathway is labeled with the red background to distinguish it due to the odd shape and overlap with the glycolysis pathway space.
