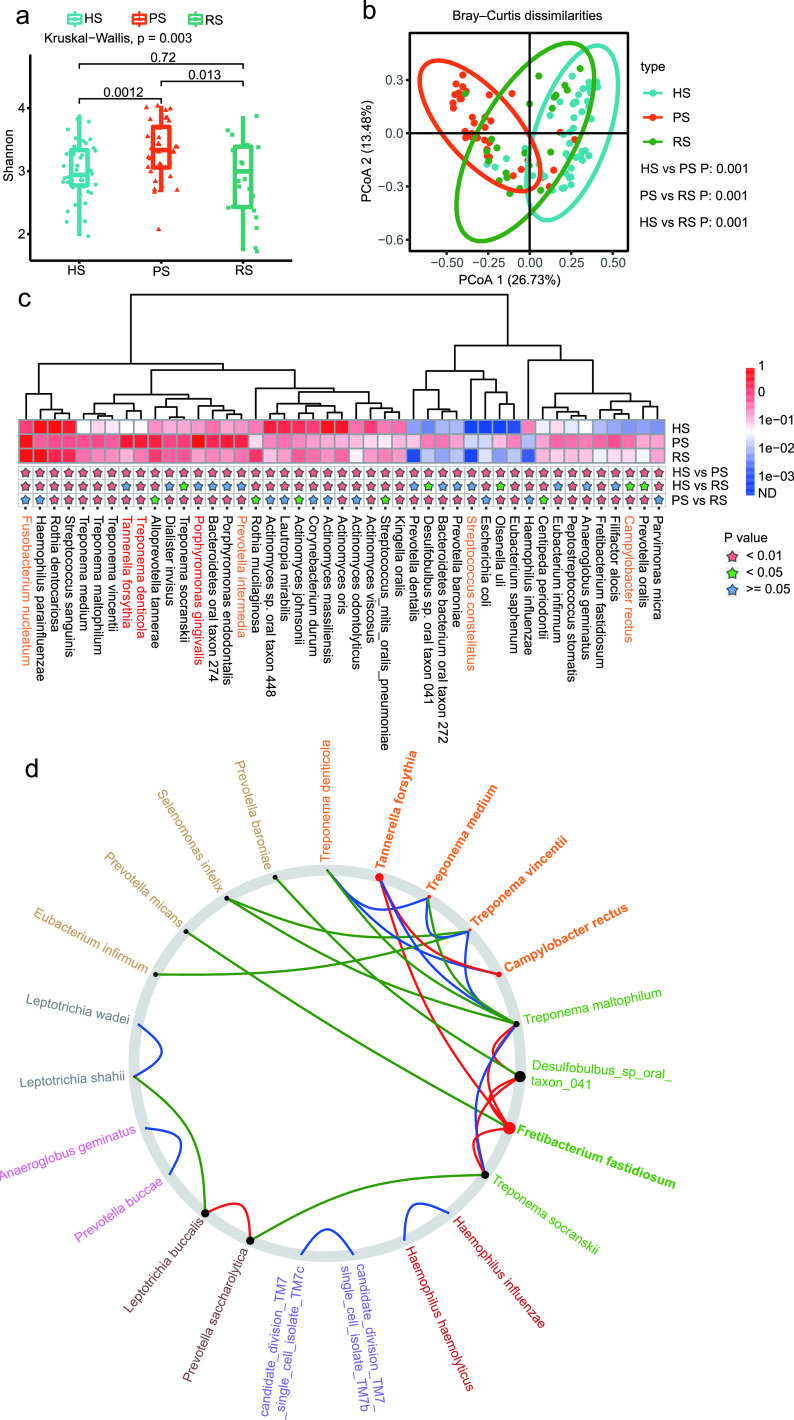
FIG 1.
Microbial community in the dental plaque among the HS group, PS group, and RS group. (a) Box plots of the Shannon-Wiener indexes of the microbial community at the species level in the HS group, PS group, and RS group. (b) PCoA of Bray-Curtis distance between the groups. (c) Relative abundance of the top 45 most different species across the groups. Species at a P value of <0.01 are marked with a pink star, a P value of <0.05 with a green star, and a P value of ≥0.05 with a blue star. The red typeface denotes the three members of the red complex; the orange typeface denotes the four members of the red complex. (d) We treated the HS and RS (after treatment) as the control and individuals with the PS (before treatment) as the case. Driver species are represented by bigger red nodes with a higher NESH score. Edge (line) is assigned between the nodes; green edges, association present only in the control; red edges, association present only in the case; and blue, association present in both control and case.

