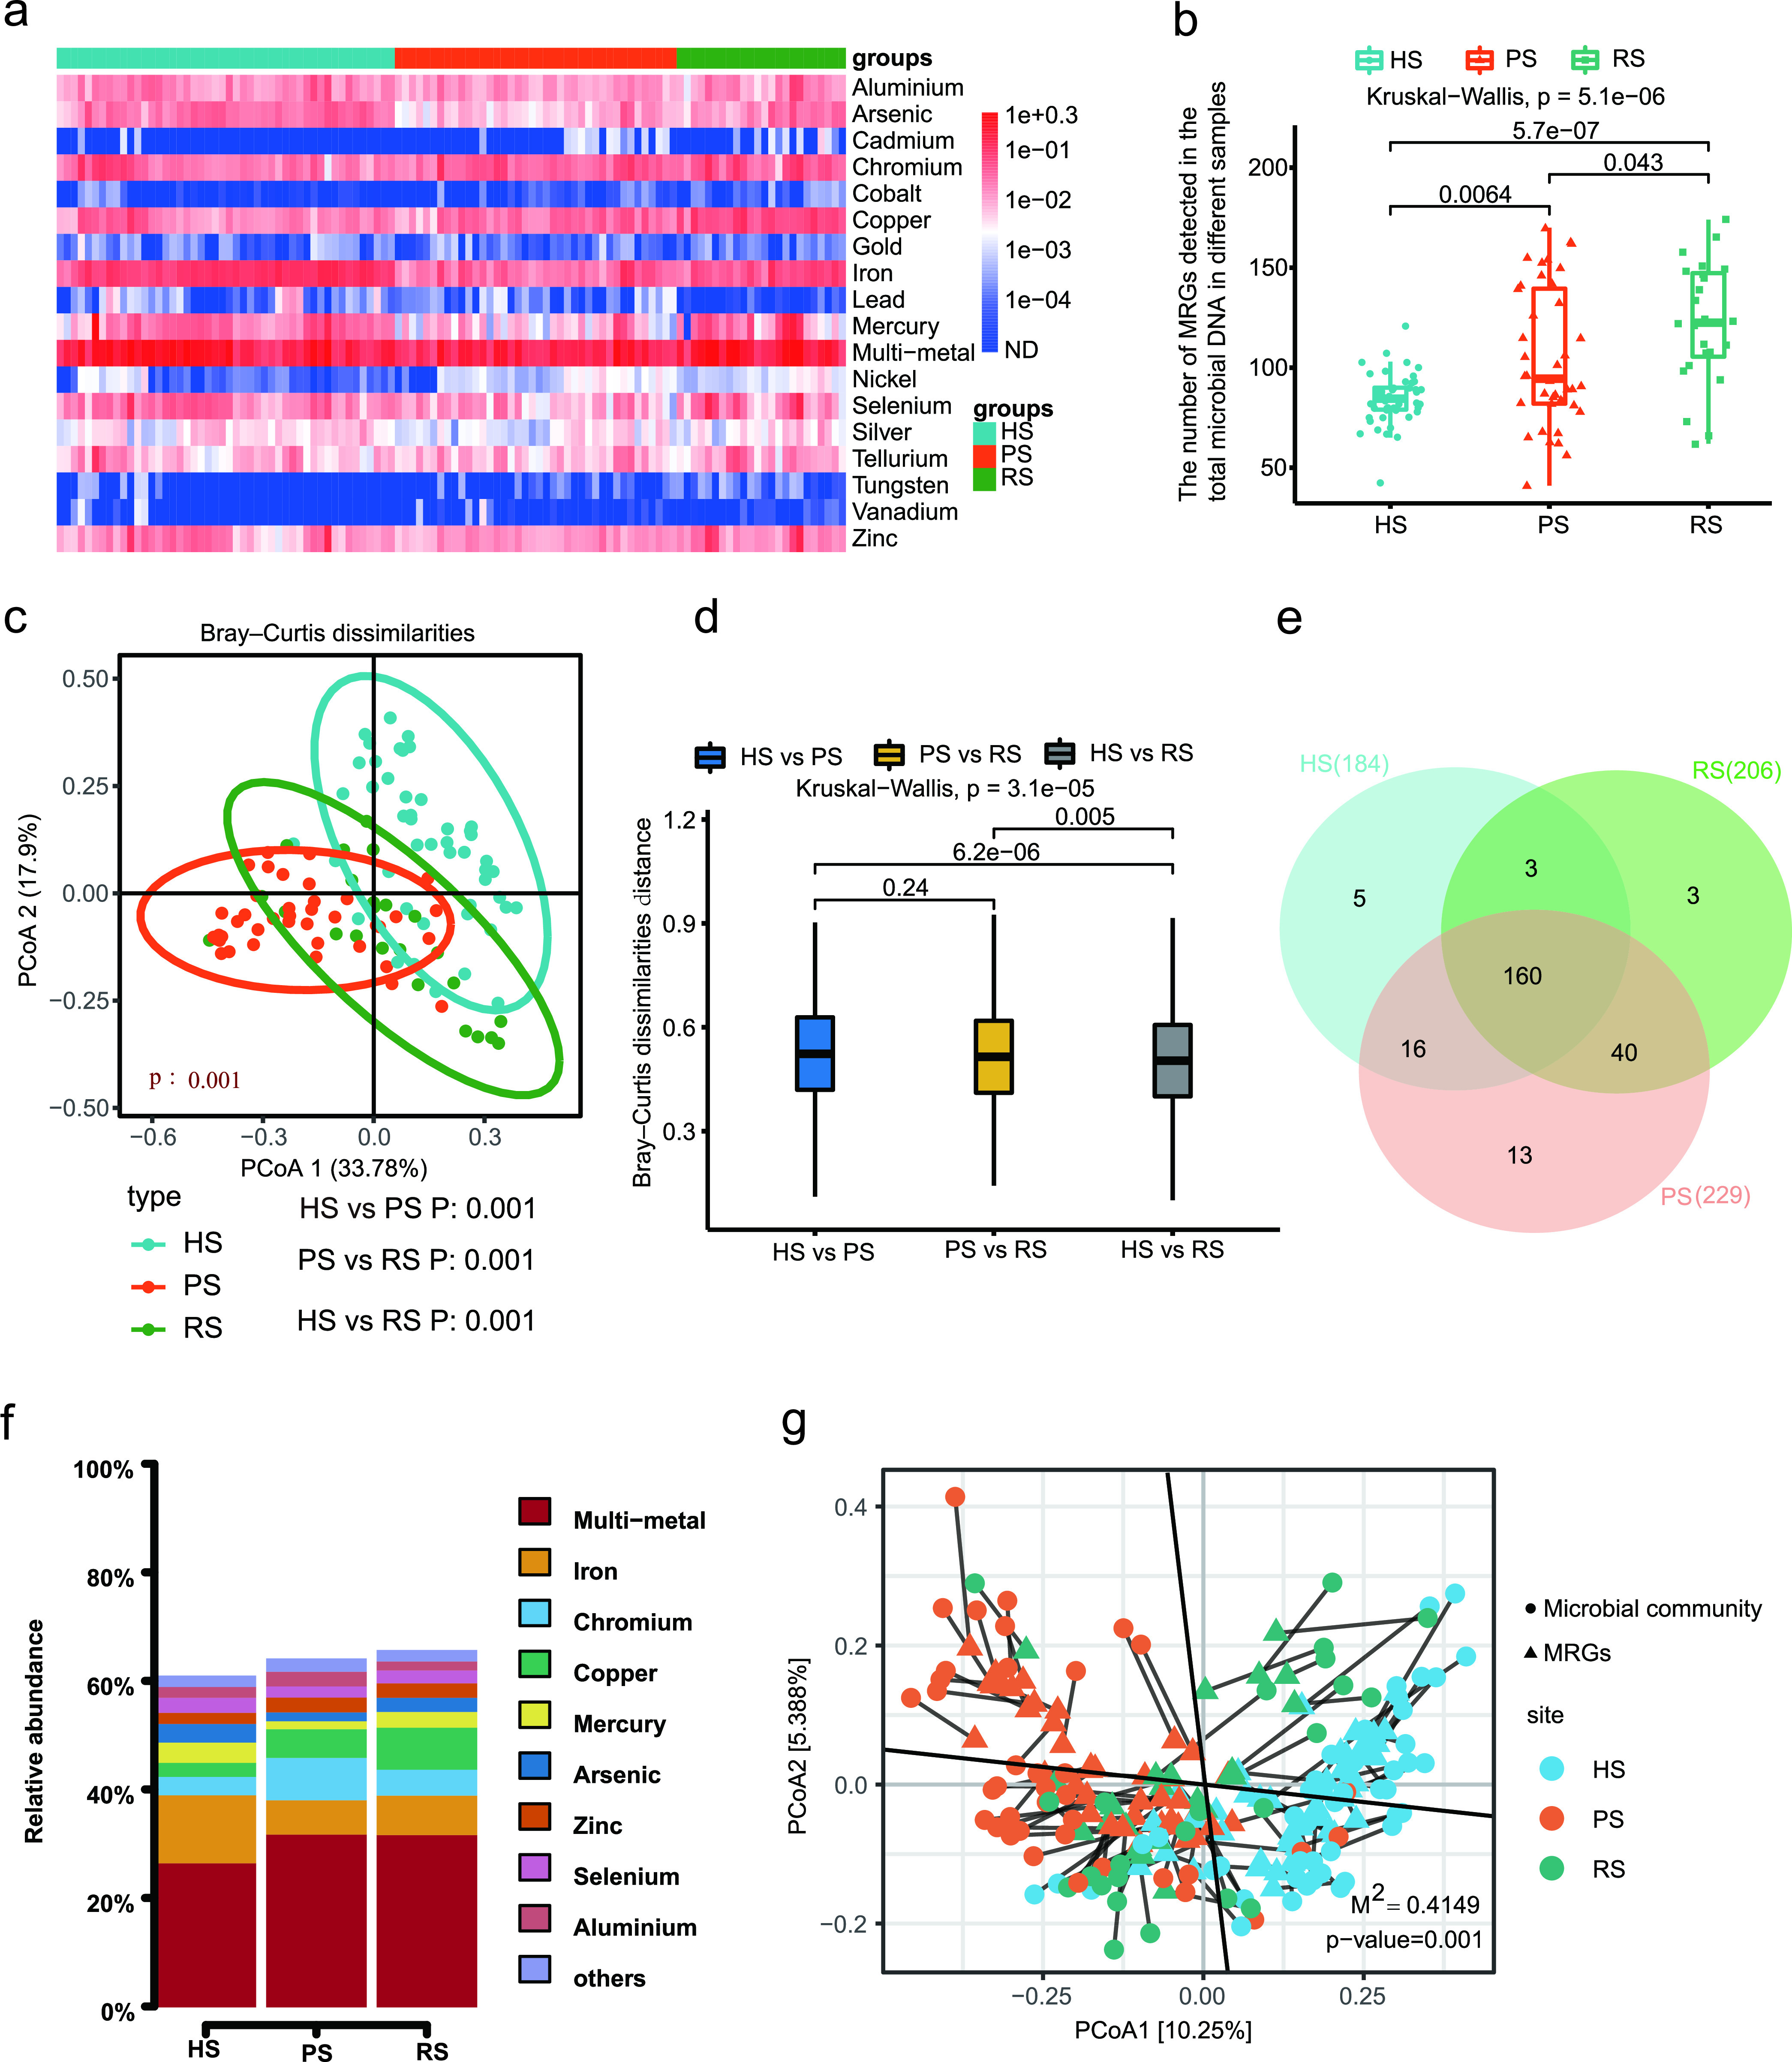
FIG 4.

Metal resistome differences among HS group, PS group, and RS group. (a) Broad-spectrum quantitative profile of the MRG types (copies/cell) in 112 dental plaque samples. (b) Box plot comparing the number of MRG subtypes among the HS group, PS group, and RS group. (c) PCoA plot showing the similarities of the MRG subtype composition among the 112 dental plaque samples in three groups. (d) Box plots showing Bray-Curtis distance between sample types. (e) Venn diagram depicting the number of shared and unique MRG subtypes among the HS group, PS group, and RS group. (f) The relative abundance (%) of shared MRGs. (g) Procrustes analysis of the correlation between ARGs and microbial community based on the PCoA (Bray-Curtis) results of MRG subtype abundances and microbial communities abundances.
