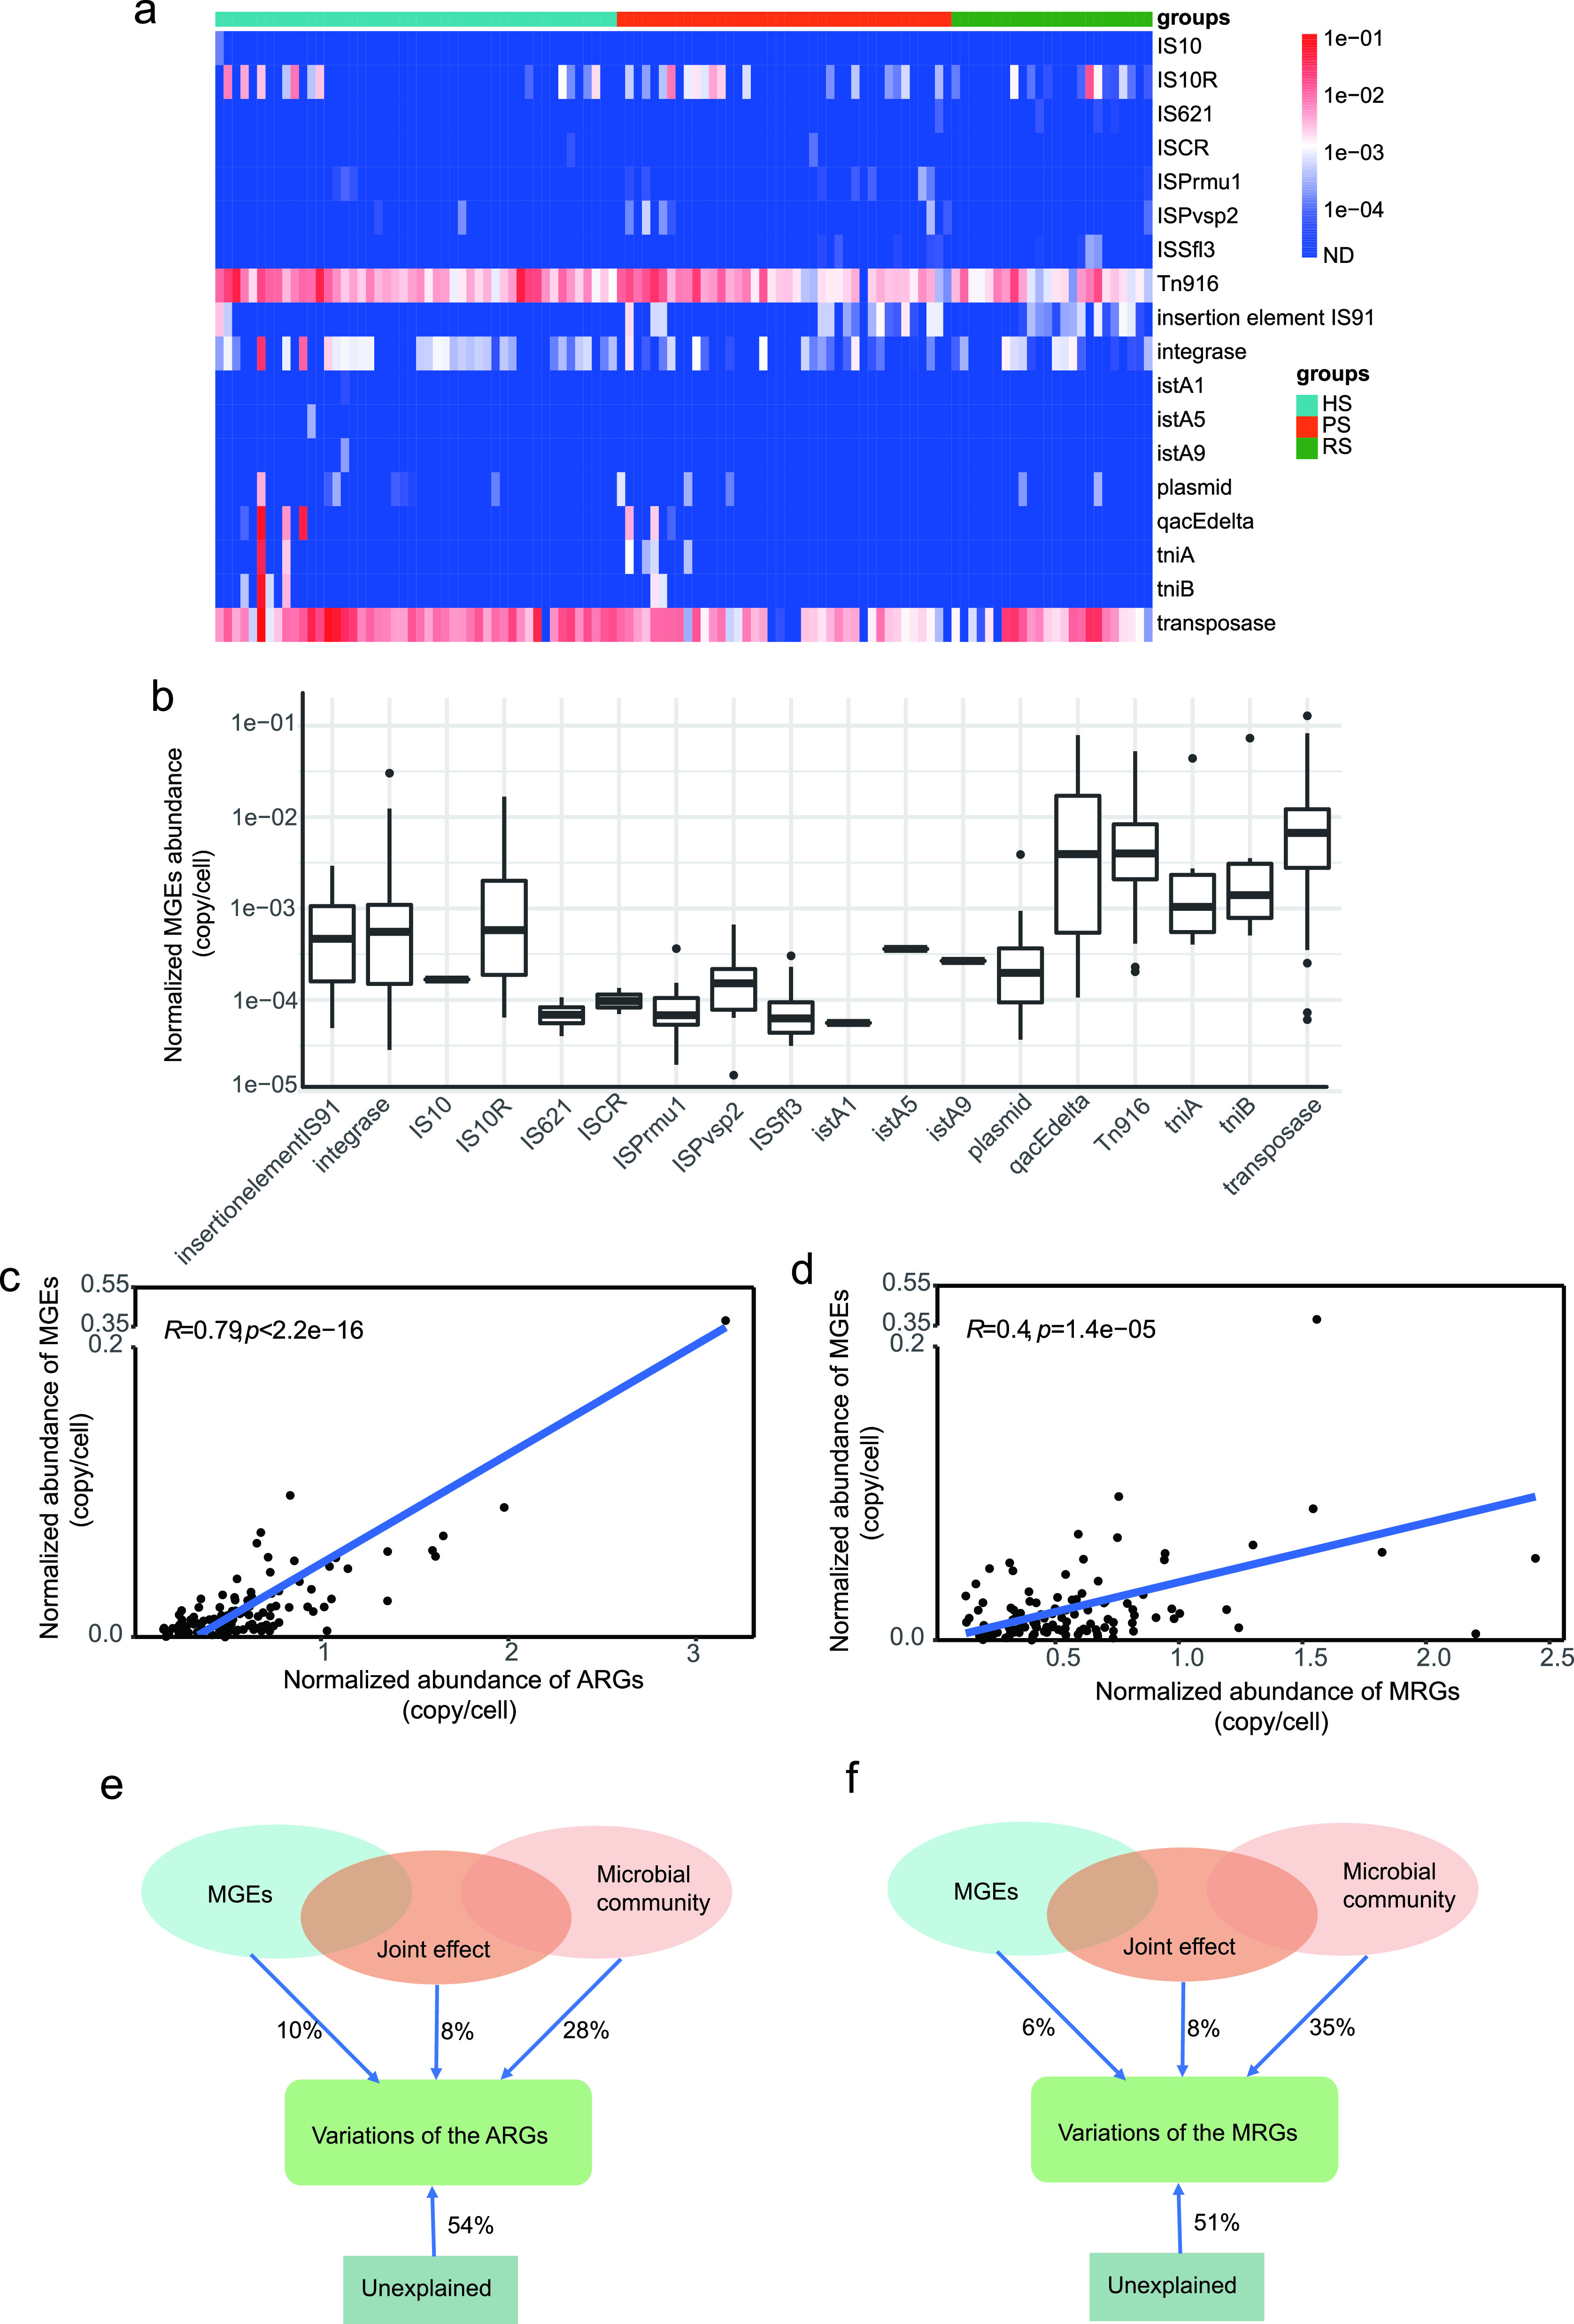
FIG 6.

Composition and correlation analysis of MGEs. (a) Broad-spectrum quantitative profile of the MGE types (copies/cell) in 112 dental plaque samples. (b) Comparison of abundances of different MGE types in the 112 samples. (c and d) The total abundance of MGEs significantly correlated with the total abundance of detected ARGs (c) and the total abundance of detected MRGs (d) based on Pearson’s correlation. (e and d) pRDA differentiating the effect of microbial communities (at the phylum level) and MGEs on the profile of ARGs (e) and MRGs (f).
