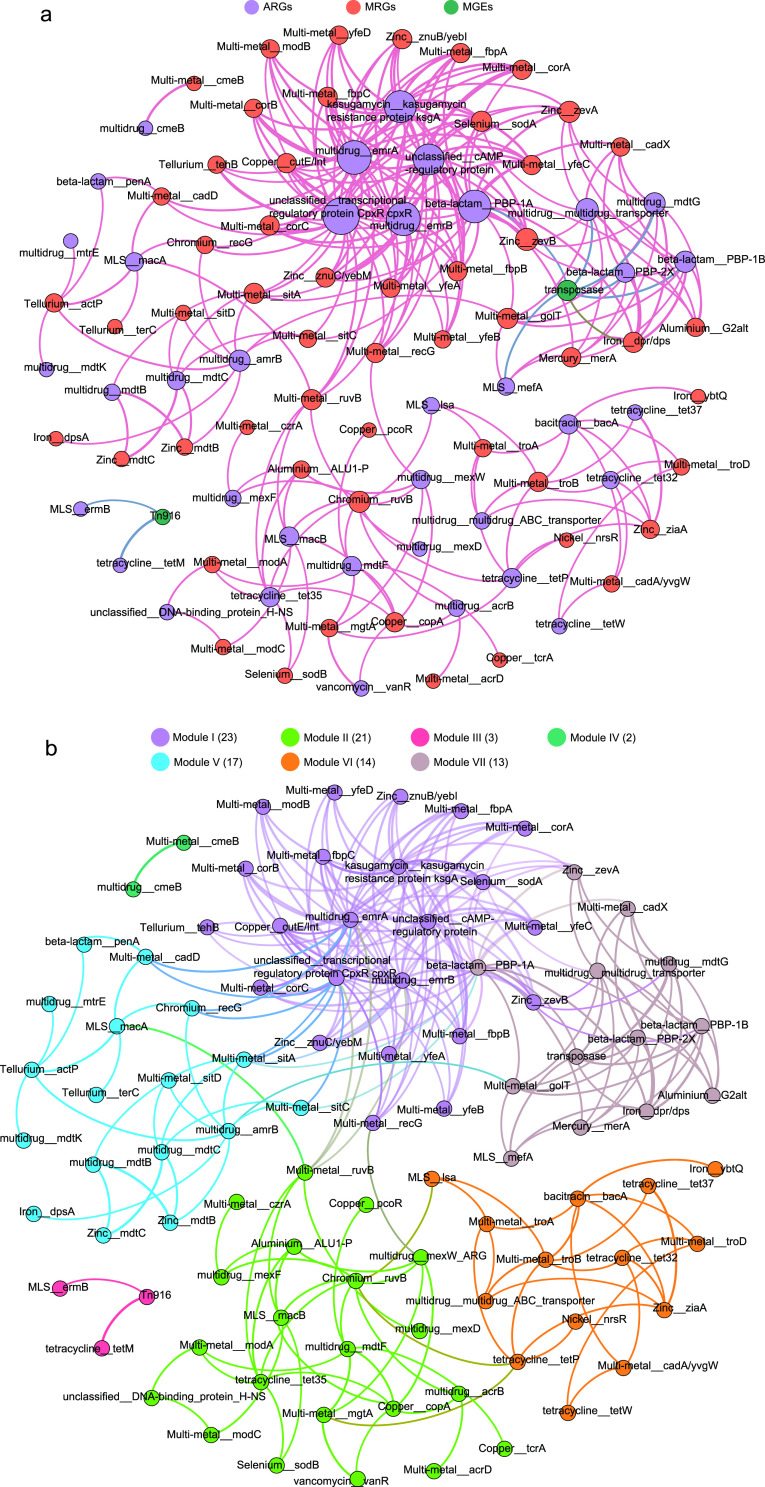
FIG 7.
Network analysis showing the cooccurrence pattern between ARGs, MRGs, and MGEs based on Pearson’s correlation analysis. A connection represents a strong (Spearman’s r, >0.6) and significant (P < 0.01) correlation. The size of each node is proportional to the number of connections. (a) The nodes were colored according to ARGs, MRGs, and MGEs. (b) The nodes were colored according to modularity class.

