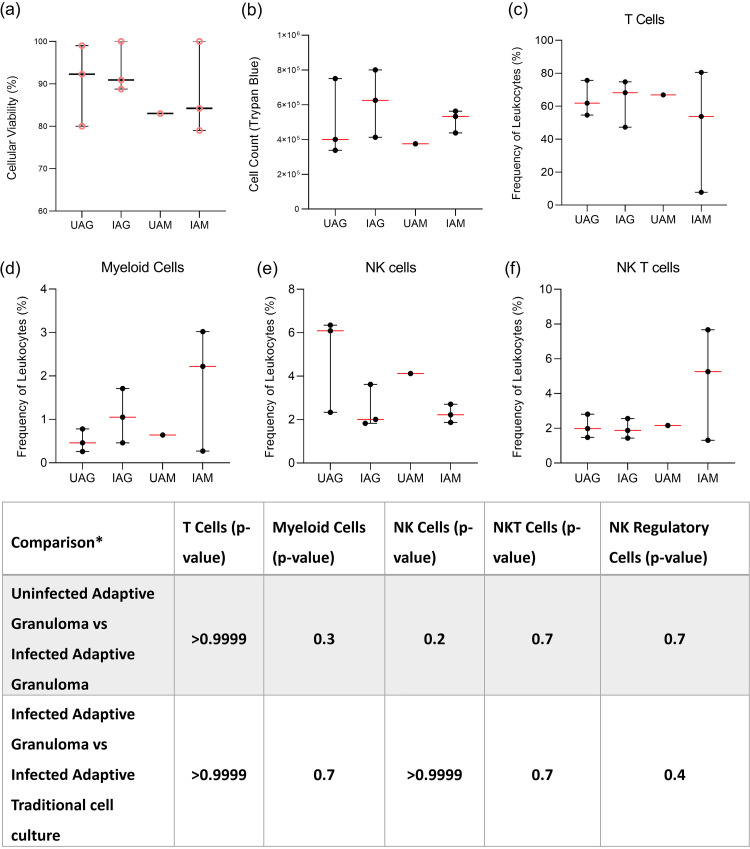
FIG 3.
From each granuloma structure from each participant, the viability of mechanically dissociated granuloma structure single cells could be determined using the (a) trypan blue exclusion method (pink, circular data points). (b) Viable cells could be counted using the trypan blue exclusion method, and using flow cytometry, the frequency of various immune cell phenotypes could be assessed after the 48-h adherence period to remove AM, including (c) CD3+ T cells, (d) CD3−CD14+ myeloid cells, (e) CD3-CD16+ natural killer (NK) cells, and (f) CD3+ CD16+ NK T cells. Cell counts and viability data are representative of cellular integrity after the final 48-h incubation for adherence for both uninfected (n = 3) and infected (n = 3) granuloma structures, as well as uninfected (n = 1) and infected (n = 3) traditional cell cultures (monolayer). Each point represents a single data point; error bars are representative of the median and range. UAG, uninfected adaptive granuloma; IAG, infected adaptive granuloma; UAM, uninfected adaptive monolayer; IAM, infected adaptive traditional. Mann-Whitney t test results for comparisons between infection groups for each cellular phenotype are given in the table below the graphs. *, comparisons could not be made between the uninfected adaptive granuloma and uninfected adaptive monolayer groups and the uninfected adaptive monolayer and infected adaptive monolayer groups due to too few data points being available for the uninfected adaptive monolayer group.

