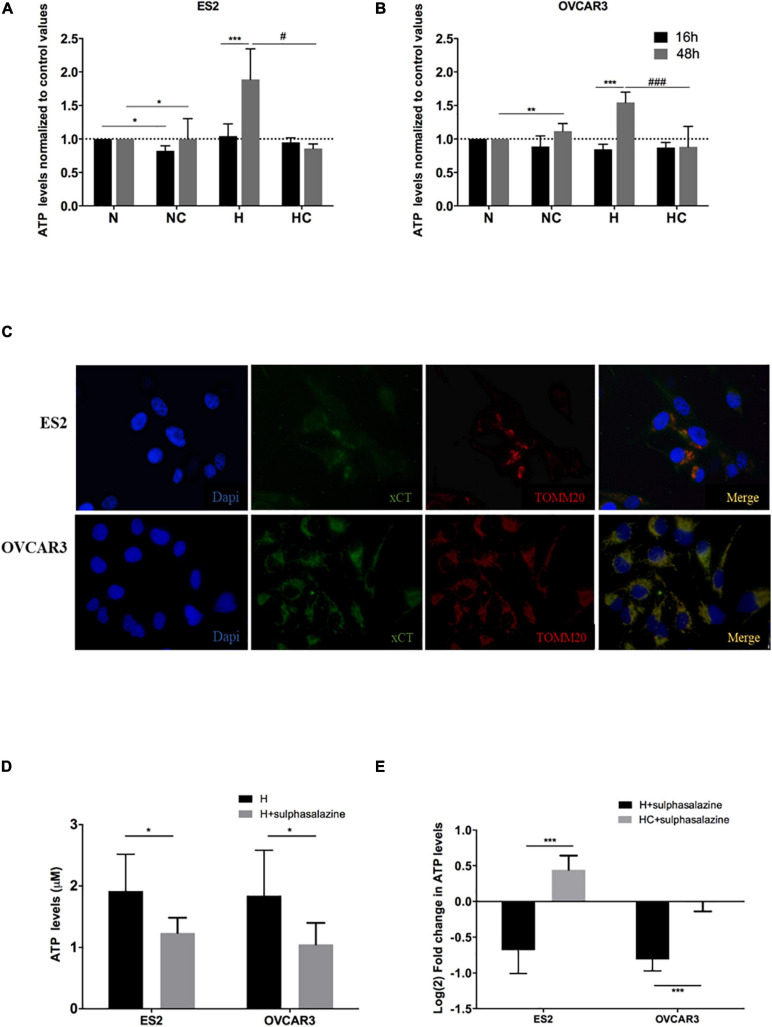
FIGURE 1.
xCT transporter localizes in ovarian cancer cells’ mitochondria and its inhibition impairs ATP production under hypoxia, which is further rescued by cysteine. ATP levels normalized to control values (normoxia without cysteine supplementation) for 16 h and 48 h of experimental conditions for (A) ES2 cells and (B) OVCAR3 cells. The differences among treatments are pointed in the figure (one-way ANOVA with post hoc Tukey tests. For ES2, n = 6 for all treatments for 16 h of experimental conditions and n = 3 for 48 h of experimental conditions. For OVCAR3, n = 6 for all experimental conditions). (C) Immunofluorescence analysis for the xCT transporter and TOMM20 under control conditions (normoxia) for ES2 and OVCAR3 cells (n = 3). (D) ATP levels for 48 h of experimental conditions for ES2 and OVCAR3 cells under hypoxia and in the presence of the xCT inhibitor, sulfasalazine. (E) ATP levels for 48 h of experimental conditions for ES2 and OVCAR3 cells under hypoxia and in the presence of sulfasalazine and cysteine. The values were normalized to the respective control and log2 fold change was calculated. The differences among treatments are pointed in panels (D,E) (independent-samples t-test; n = 6 for all experimental conditions and for both cell lines). N, normoxia; NC, normoxia with cysteine; H, hypoxia; HC, hypoxia with cysteine. Results are shown as mean ± SD. */#p < 0.05, **/##p < 0.01, ***/###p < 0.001.

