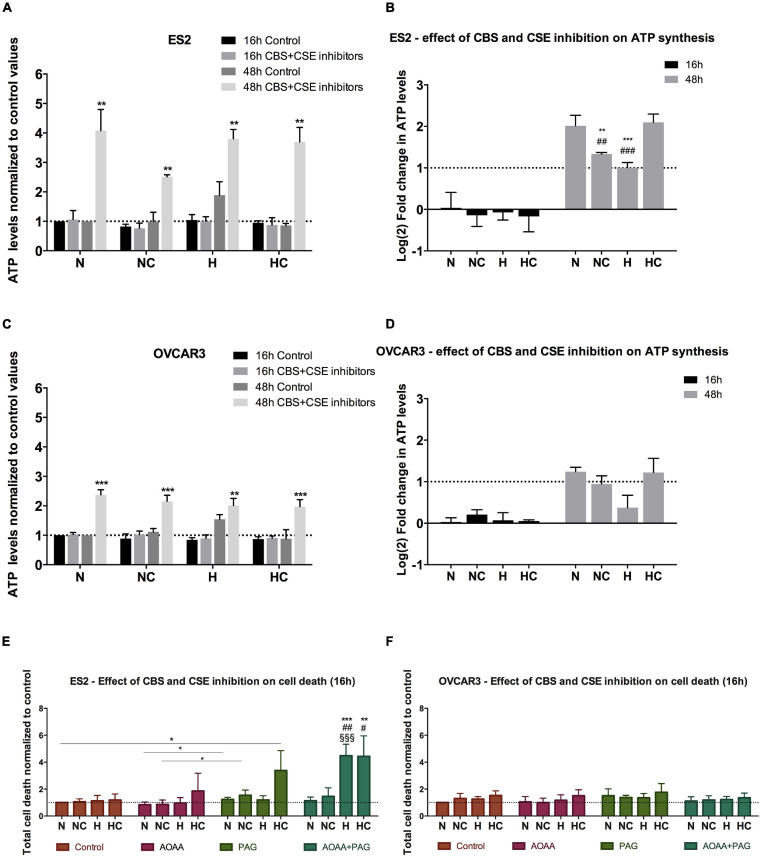
FIGURE 2.
CBS and CSE inhibition does not impair ATP synthesis in ovarian cancer cells but affect ES2 cells survival, mainly in hypoxia-mimicked conditions. (A–D) ATP levels in the presence of 1 mM AOOA and 3 mM PAG for 16 h and 48 h of experimental conditions for ES2 [A – values normalized to control (normoxia without cysteine and without inhibitors) and (B) – values normalized to the respective control and log2 fold change calculation] and OVCAR3 [C – values normalized to control (normoxia without cysteine and without inhibitors) and (D) – values normalized to the respective control and log2 fold change calculation] cells. (A,C) The asterisks (*) represent the statistical significance compared to the respective control. (B,D) The asterisks (*) represent the statistical significance compared to N, the section symbols (§) represents the statistical significance compared to NC and the cardinals (#) represent statistical significance compared to HC. For ES2, n = 6 for all treatments for 16 h of experimental conditions and n = 3 for 48 h of experimental conditions. For OVCAR3, n = 6 for all experimental conditions. (E,F) Cell death levels in the control condition, in the presence of CBS/CSE inhibitor (1 mM AOAA), CSE inhibitor (3 mM PAG) or both inhibitors for ES2 (E) and OVCAR3 (F) cells. The asterisks (*) represent statistical significance between the respective treatments or between AOAA + PAG and its control, the cardinals (#) represent statistical significance between AOAA + PAG and AOAA alone and the section symbols (§) represent statistical significance between AOAA + PAG and PAG alone. For both cell lines, at least n = 6 were performed for all experimental conditions. N, normoxia; NC, normoxia with cysteine; H, hypoxia; HC, hypoxia with cysteine. Results are shown as mean ± SD. *p < 0.05, **p < 0.01, ***p < 0.001 [(A,C) independent-samples t-test; (B,D–F) one-way ANOVA with post hoc Tukey tests].

