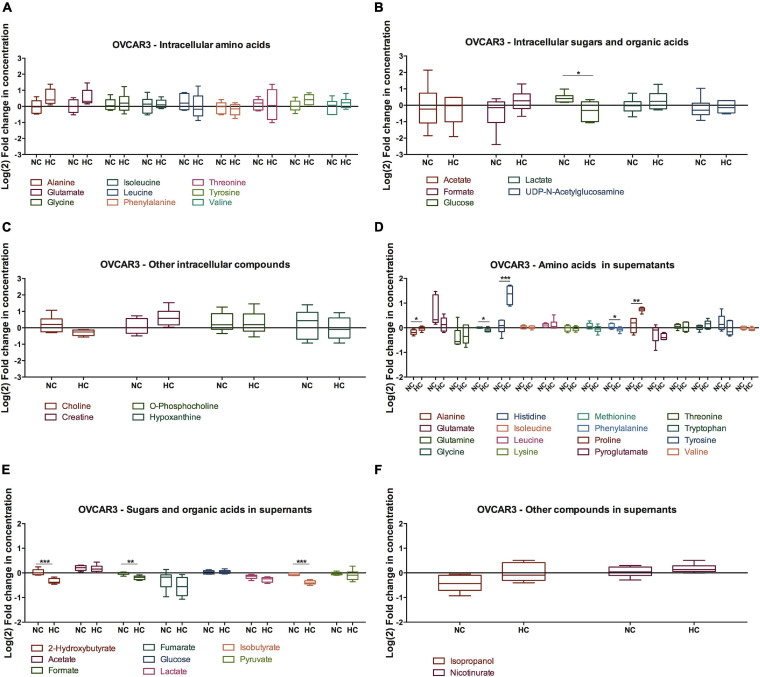
FIGURE 5.
Effect of cysteine in OVCAR3 metabolites under normoxia and hypoxia. Metabolites levels for 48 h of experimental conditions for OVCAR3 cells. (A) Intracellular amino acids; (B) intracellular sugars and organic acids; (C) other intracellular metabolites; (D) amino acids in supernatants; (E) sugars and organic acids in supernatants; (F) other metabolites in supernatants. Data were normalized to the respective control condition (the same environmental condition NC/N and HC/H). NC, normoxia with cysteine; HC, hypoxia with cysteine. Results are shown as median with 25th to 75th percentiles. *p < 0.05, **p < 0.01, ***p < 0.001 (independent-samples t-test: NC, n = 6; HC, n = 6).

