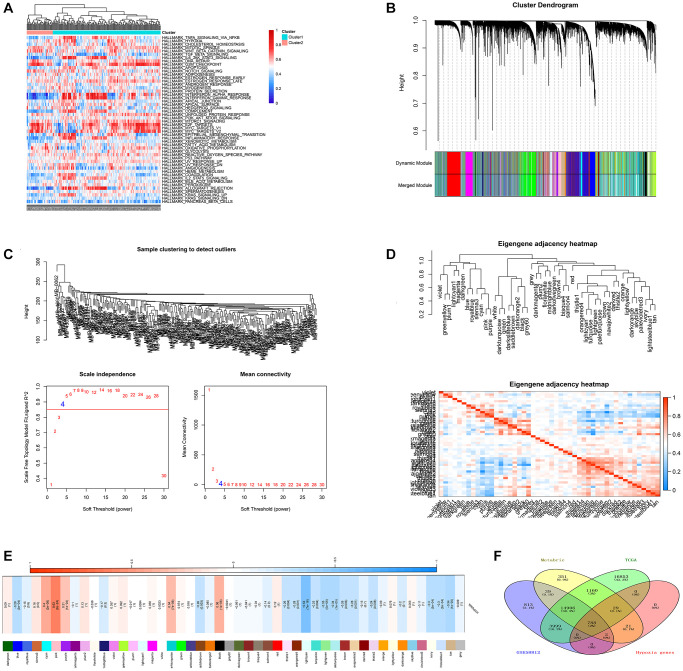
Figure 2.
Identification of potential HRGs in TNBC. (A) Hypoxia ssGSEA scores were estimated in the METABRIC cohort. (B) WGCNA was applied with whole-transcriptome profiling data and hypoxia ssGSEA Z-scores. (C) The optimal soft threshold to confirm a scale free co-expression network. (D) A total of 47 non-grey modules were identified. (E) The pink module depicted the highest correlation (r = 0.64, p = 2e−24) with hypoxia. (F) Venn diagram suggested 788 hypoxia related genes in the three cohorts.

