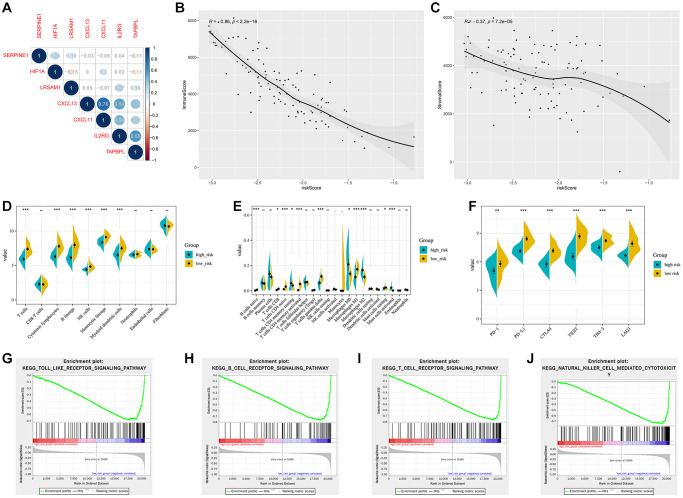
Figure 8.
Validation of the hypoxia and immune related gene signature in the GSE103091 cohort. (A) Correlation network between the gene signature and HIF1A. Correlation between the risk score and immune score (B) and stromal score (C). (D) Association of MCP-counter-estimated infiltrating cells with the risk score. (E) Comparison of infiltrating immune cells (CIBERSORT) between different risk groups. (F) the expression of immune checkpoint targets between different risk groups. (G–J) GSEA of enriched immune-related signaling in the HIRS-based groups.

