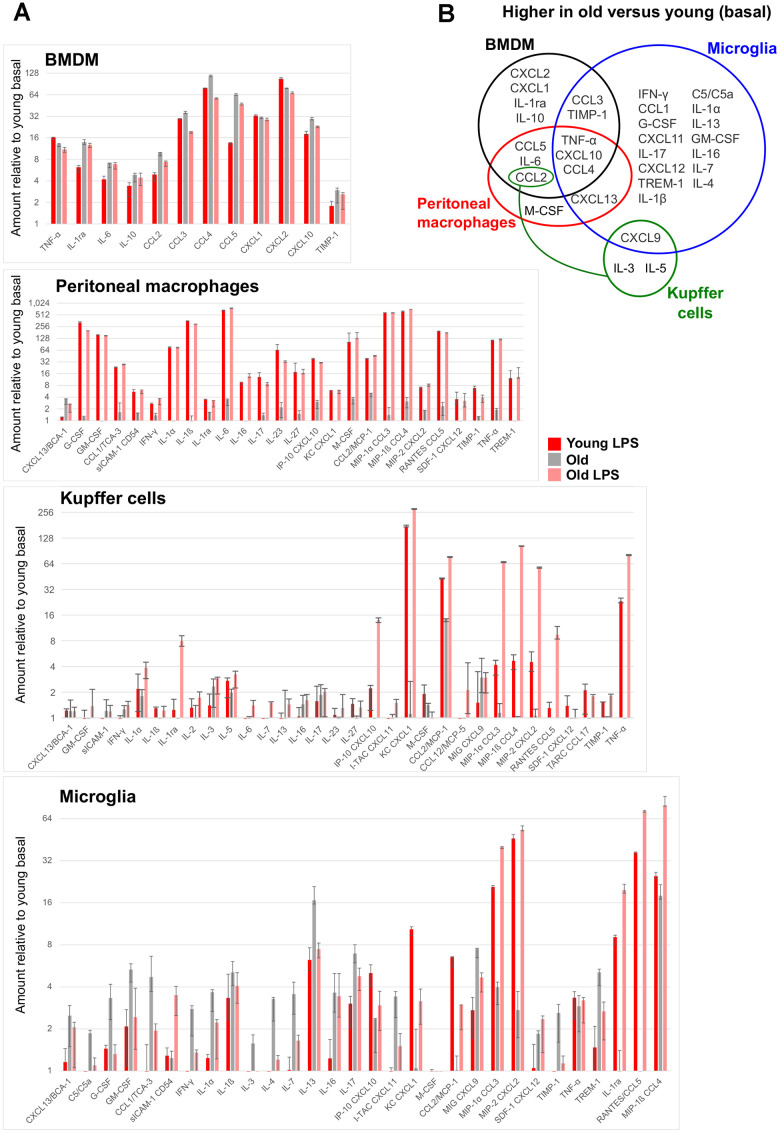
Figure 4.
Age-associated changes in cytokine secretion. For each tissue-resident macrophage population in the indicated age group, supernatants were collected from cells untreated or treated with 10 ng/ml LPS for 8 hours, and were subject to a multiplex cytokine detection assay (see Methods). (A) In each plot for the indicated macrophage population, only the cytokines that were detectable in at least one condition are included. (B) A Venn diagram shows the overlap between the cytokines whose secretion was basally elevated with age in each macrophage population.

