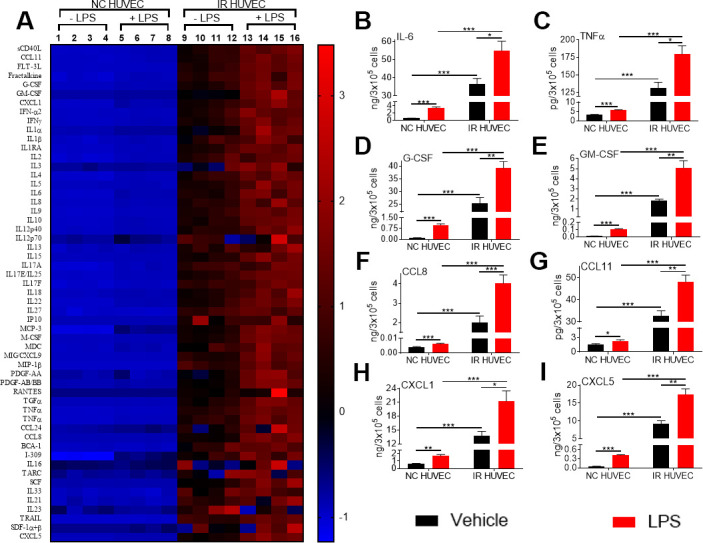
Figure 3.

Comparison of the production of inflammatory cytokines and chemokines by NC HUVEC and IR HUVEC. (A) Heat-map representing the normalized concentrations of inflammatory cytokines and chemokines in the conditioned media of NC HUVEC and IR HUVEC stimulated with vehicle or LPS (30 ng/ml) for 24 hours. (B–I) Normalized concentration of IL6 (B), TNFα (C), G-CSF (D), GM-CSF (E), CCL8 (F), CCL11 (G), CXCL1 (H), and CXCL5 (I), produced by NC HUVEC and IR HUVEC stimulated with vehicle or LPS (30 ng/ml) for 24 hours. (n = 4; mean ± SEM; * p<0.05, ** p<0.01, *** p<0.001).
