Figure 1.

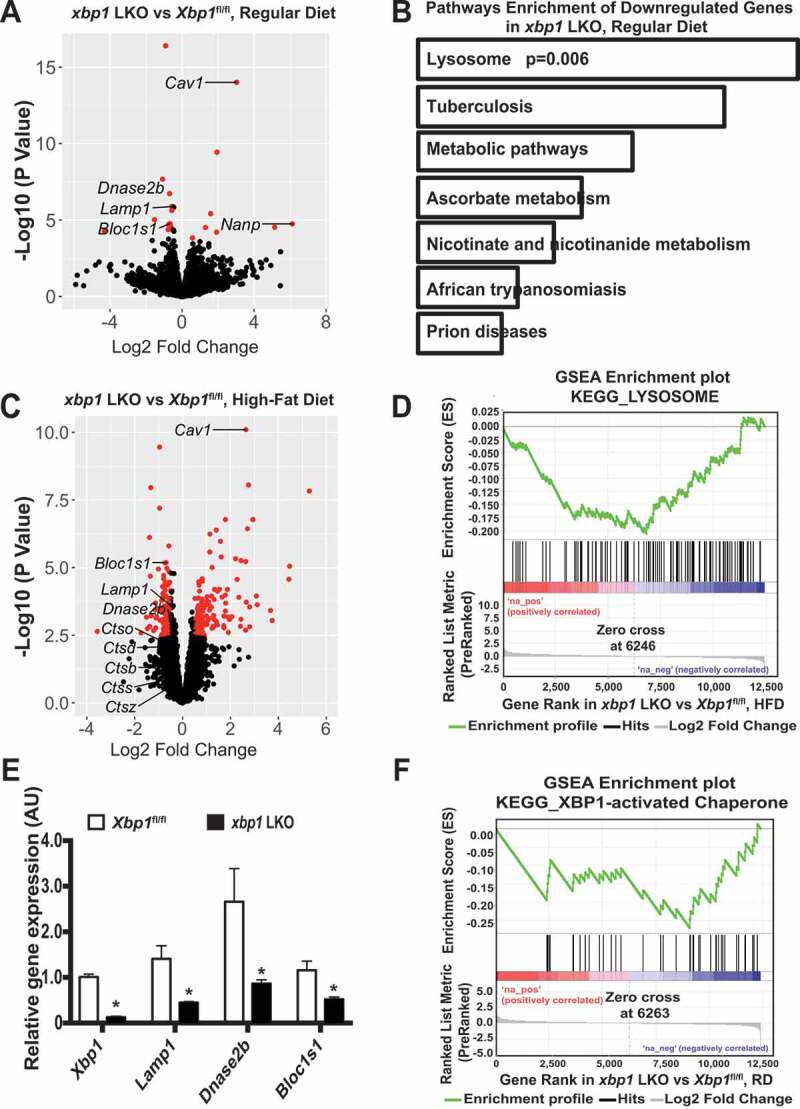
XBP1 regulates genes involves in lysosome dynamics. (A) Volcano plot comparing RNA-seq data of livers from male xbp1 LKO mice vs. Xbp1fl/fl mice on a RD following a 16-h fast. The figure illustrates the relationship of FC (log base 2) to the p-value (-log base 10). The red dots represent differential expressed genes that have false discovery rate (FDR) <0.1 and absolute log2 fold-change>0.5. n = 3 mice/group. (B) Pathways that are significantly downregulated in the livers of xbp1 LKO vs. Xbp1fl/fl mice treated as in (A). KEGG categories are determined by Enrichr analysis. (C) Volcano plot comparing RNA-seq data of livers of male xbp1 LKO mice vs. Xbp1fl/fl mice on HFD (16 wks) following a 16-h fast. The figure illustrates the relationship of FC (log base 2) to the p-value (-log base 10). The red dots represent differential expressed genes that have false discovery rate (FDR) <0.1 and absolute log2 fold-change>0.5. n = 3 mice/group. (D) Gene Set Enrichment Analysis (GSEA) plot illustrates significant downregulation of the lysosomal pathway in livers of male xbp1 LKO mice compared with Xbp1fl/fl mice as in (C). (E) Levels of mRNAs encoding genes of interest in livers from mice on a RD following a 16-h fast as in (A), as assessed by quantitative RT-PCR. Data are presented as means ± SEM. * indicates the statistical significance of the difference between xbp1 LKO and Xbp1fl/fl mice, as determined by Student’s t-test (* p < 0.05, n = 3 mice/group). (F) GSEA plot showing significant downregulation of XBP1 target genes in livers from xbp1 LKO mice vs. Xbp1fl/fl mice as in (A)
