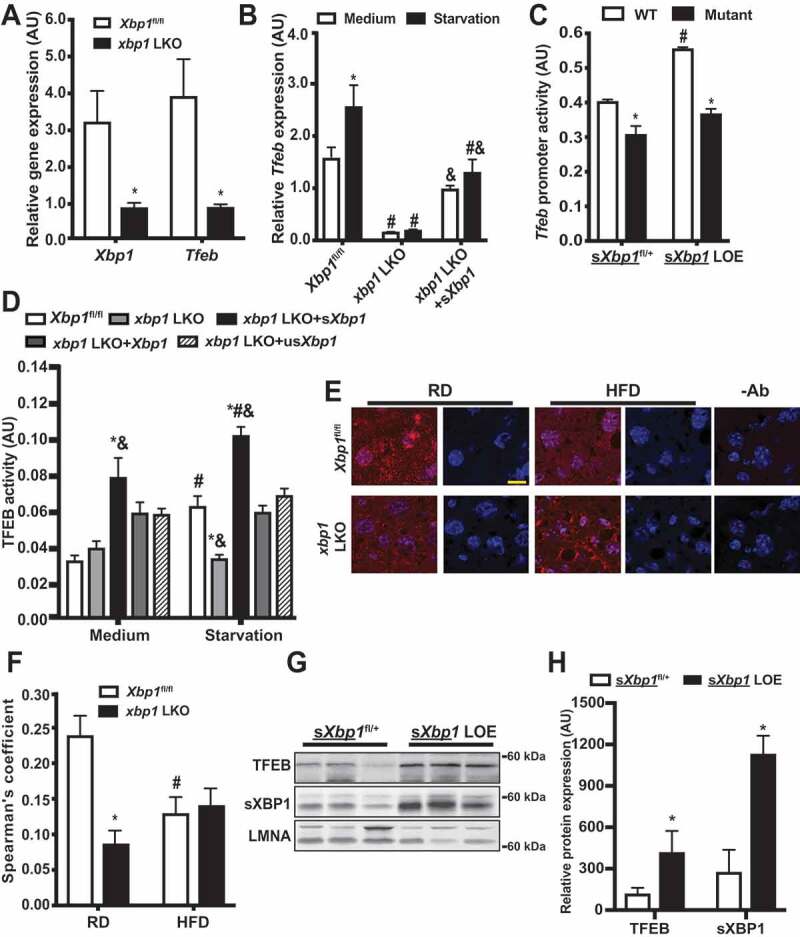
Figure 3.

sXBP1 activates TFEB in the liver. (A and B) Levels of mRNAs encoding tested proteins in (A) liver and (B) primary hepatocytes isolated from Xbp1fl/fl mice and xbp1 LKO mice as assessed by quantitative RT-PCR. Data are normalized to Hprt. * indicates statistical significance compared to (A) Xbp1fl/fl, and (B) treatment of medium in the same cell type. # indicates statistical significance compared to the Xbp1fl/fl group with the same treatment; and & indicates statistical significance between xbp1 LKO groups in (B) (n = 3–4, biological replicates). (C) Activity of the Tfeb promoter in primary hepatocytes from sXbp1fl/+ and sXbp1 LOE mice following transfection with the indicated Tfeb-Luc constructs for 48 h and subsequent treatment with EBSS (starvation, 4 h). The data were normalized to Renilla luciferase. * indicates statistical significance compared to WT construct within the same genotype, and # indicates statistical significance compared to sXbp1fl/+ cells with the same construct (n = 4, biological replicates). AU, arbitrary units. (D) Activity of TFEB in primary hepatocytes from Xbp1fl/fl mice and xbp1 LKO mice transduced with the indicated adenoviral constructs; the Ad-GFP was used as a control virus. Cells were isolated and then transfected with 4XCLEAR luciferase reporter construct for 48 h and subsequently treated with EBSS (starvation, 4 h). The data were normalized to those for Renilla luciferase. * indicates statistical significance compared to the Xbp1fl/fl group with same treatment, # indicates statistical significance compared to treatment with medium in cells with same construct, and & indicates statistical significance between xbp1 LKO groups with the same treatment (n = 4, biological replicates). AU, arbitrary units. (E) Representative confocal images (63X) of TFEB staining in livers of Xbp1fl/fl and xbp1 LKO mice fed a RD or HFD (16 wks on HFD, fasted for 16 h). Red, TFEB; blue, DAPI. -Ab: no anti-TFEB controls. Scale bar: 20 μm. (F) Quantification of co-localization of TFEB staining in livers in (E). * indicates the statistical significance compared to the Xbp1fl/fl group, and # indicates the statistical significance between RD and HFD in the same genotype of mice (8 fields/group; n = 3, biological replicates). (G) Western blot analysis showing expressions of XBP1 and TFEB in nuclear fractions from livers of sXbp1fl/+ and sXbp1 LOE mice following fast for 16 h. (H) Quantification of TFEB and sXBP1 nuclear expression in livers from sXbp1fl/+ and sXbp1 LOE mice as in (G). All data are shown as means ± SEM. * indicates the statistical significance compared to the sXbp1fl/+ group (n = 3–4 biological replicates). Statistical significances were determined by Student’s t-test in A and H, and ANOVA followed by Tukey’s multiple comparisons test in B-D and F, p < 0.05
