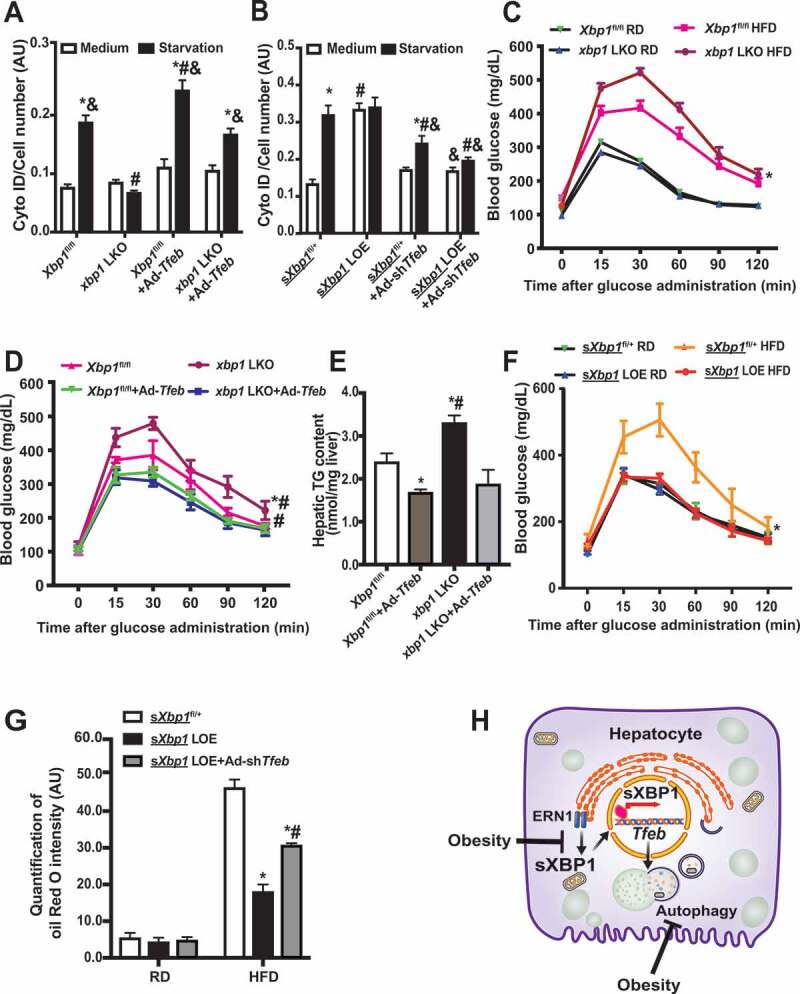
Figure 5.

Impairment of XBP1-TFEB axis contributes to obesity-associated INS resistance. (A) Intensity of Cyto-ID in live primary hepatocytes from Xbp1fl/fl mice and xbp1 LKO mice following transduction of the indicated adenoviral constructs for 48 h and subsequent treatment with EBSS (starvation) for 4 h. * indicates statistical significance compared to treatment of medium groups in cells with the same construct, # indicates statistical significance compared to the Xbp1fl/fl groups with the same treatment, and & indicates statistical significance compared to xbp1 LKO groups with same treatment (n = 3, biological replicates). (B) Intensity of Cyto-ID in live primary hepatocytes from sXbp1fl/+ mice and sXbp1 LOE mice following transduction of the indicated adenoviral constructs and subsequent treatment with EBSS (starvation) for 4 h. * indicates statistical significance compared to treatment of medium groups in cells with the same type of construct, # indicates statistical significance compared to the sXbp1fl/+ groups with same treatment, and & indicates statistical significance compared to the sXbp1 LOE groups with the same treatment (n = 3, biological replicates). (C) Glucose tolerance test in Xbp1fl/fl mice transduced with AAV8-Serpina7-eGFP (Xbp1fl/fl) or AAV8-Serpina7-iCre (xbp1 LKO) and fed a RD or HFD (12 wks on HFD). * indicates statistical significance between Xbp1fl/fl and xbp1 LKO groups (n = 6–8 mice/group). (D) Glucose tolerance test in Xbp1fl/fl mice and xbp1 LKO mice fed HFD followed by transduction with Ad-Tfeb. * indicates statistical significance between Xbp1fl/fl and xbp1 LKO groups, and # indicates statistical significance compared to Ad-Tfeb groups in same type of mice (n = 6–8 mice/group). (E) Hepatic triglyceride (TG) levels in livers from mice in (D). * indicates statistically significant difference compared to the Xbp1fl/fl group, and # indicates statistically significant difference between the xbp1 LKO groups (n = 4–5 mice/group). (F) Glucose tolerance in sXbp1fl/+ mice transduced with AAV8-Serpina7-eGFP (sXbp1fl/+) or AAV8-Serpina7-iCre (sXbp1 LOE) and fed a RD or HFD (12 wks on HFD). * indicates statistical significance between the HFD groups (n = 6–8 mice/group). (G) Quantification of Oil Red O intensity in livers from sXbp1fl/+ mice and sXbp1 LOE mice fed with HFD (12 wks on HFD) followed by transduction with Ad-shTfeb. * indicates statistically significant difference relative to the sXbp1fl/+ group, and # indicates statistically significant difference between the sXbp1 LOE groups (n = 3, biological replicates). (H) Working model of this study. In the liver, the ER and autophagy are functionally coupled at the transcriptional level via sXBP1-mediated Tfeb expression. Loss of the crosstalk between the UPR and lysosomal dynamics leads to impaired hepatic autophagy and insulin resistance in the context of obesity. All data are presented as means ± SEM. Statistical significance was determined by ANOVA followed by Tukey’s multiple comparisons test in A&B&E&G, and by ANOVA followed by Tukey’s multiple comparisons test of area under a curve (AUC) in C, D and F, p < 0.05
