
Figure 2.
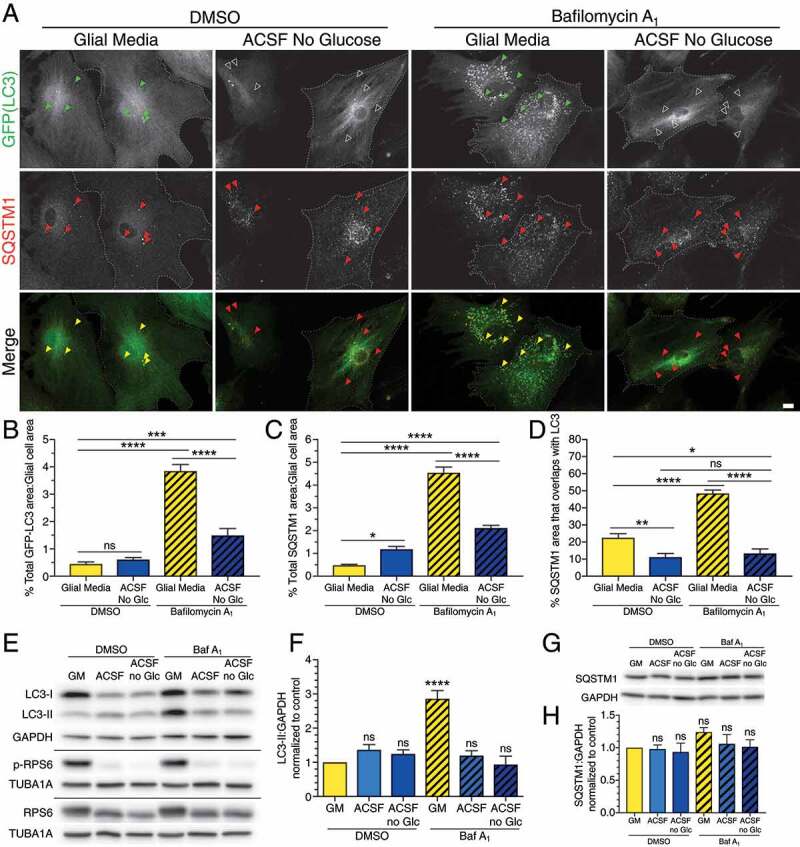
Starvation in ACSF dampens autophagy in primary astrocytes and induces a switch to SQSTM1-independent autophagy. (A) Maximum projections of Z-stacks of GFP-LC3 transgenic astrocytes starved in ACSF without glucose for 4 h and immunostained for GFP and SQSTM1. Closed arrowheads denote puncta co-positive for GFP-LC3 and SQSTM1. Open arrowheads denote SQSTM1-positive puncta that are not co-positive for GFP-LC3. Outlines define cell boundaries. Bar: 10µm. (B) Quantification of total GFP-LC3 puncta area normalized to cell area of astrocytes starved in ACSF without glucose for 4 h (mean ± SEM; one-way ANOVA with Tukey’s post hoc test; n = 58–68 cells from 4 independent experiments, 3–6 DIV). (C) Quantification of total SQSTM1 puncta area normalized to cell area of astrocytes starved in ACSF without glucose for 4 h (mean ± SEM; one-way ANOVA with Tukey’s post hoc test; n = 58–91 from 4 independent experiments, 3–6 DIV). (D) Quantification of the percentage of SQSTM1 puncta area that overlaps with GFP-LC3 puncta area in astrocytes starved in ACSF without glucose for 4 h (mean ± SEM; one-way ANOVA with Tukey’s post hoc test; n = 38–53 cells from 3 independent experiments, 5–6 DIV cells). (E and F) Immunoblot analysis and quantification of lysates generated from glia starved in ACSF ± glucose for 4 h. (E) GAPDH and TUBA1A/α-tubulin serve as loading controls; horizontal lines designate individual blots. (F) LC3-II levels were normalized to GAPDH (mean ± SEM; one-way ANOVA with Dunnett’s post hoc test; n = 3 independent experiments, 3–6 DIV). (G and H) Immunoblot analysis and quantification of SQSTM1 levels in glia starved in ACSF ± glucose for 4 h. SQSTM1 levels were normalized to GAPDH (mean ± SEM; one-way ANOVA with Dunnett’s post hoc test; n = 3 independent experiments, 3–6 DIV). Baf A1, bafilomycin A1; Glc, glucose; GM, glial media.