
Figure 4.
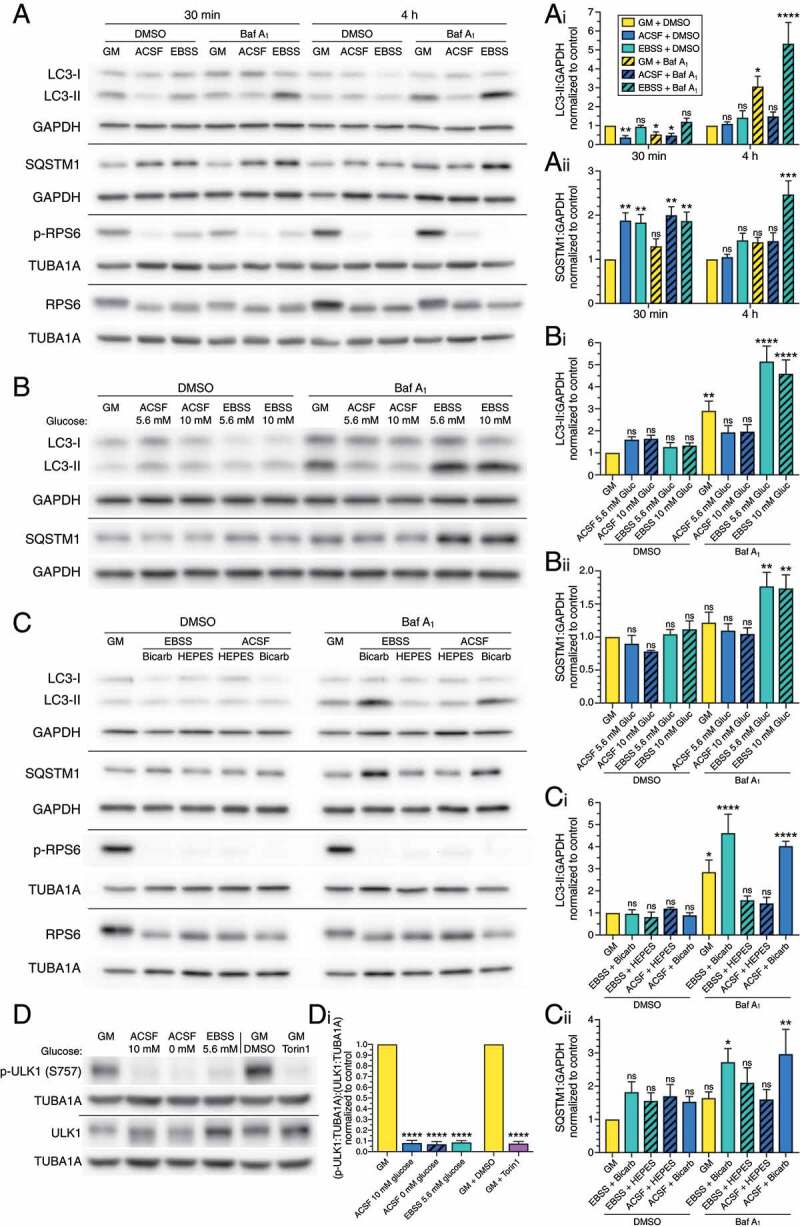
Starvation in EBSS activates autophagy in a buffer-dependent manner. (A-Aii) Immunoblot analysis and corresponding quantification of glia starved in ACSF versus EBSS for 30 min or 4 h. LC3-II and SQSTM1 levels were normalized to GAPDH (mean ± SEM; one-way ANOVA with Dunnett’s post hoc test; statistical tests were performed independently for each time point; n = 3–5 independent experiments, 5–7 DIV). (B-Bii) Immunoblot analysis and corresponding quantification of glia starved for 4 h in ACSF vs EBSS with either 5.6 mM or 10 mM glucose. LC3-II and SQSTM1 levels were normalized to GAPDH (mean ± SEM; one-way ANOVA with Dunnett’s post hoc test; n = 4 independent experiments, 4–5 DIV). (C-Cii) Immunoblot analysis and corresponding quantification of glia starved for 4 h in ACSF versus EBSS with either HEPES or bicarbonate/phosphate buffering systems. LC3-II and SQSTM1 levels were normalized to GAPDH (mean ± SEM; one-way ANOVA with Dunnett’s post hoc test; n = 3 independent experiments, 4–8 DIV). (D and Di) Immunoblot analysis and corresponding quantification of glia starved for 4 h in the indicated salt solutions. p-ULK1:TUBA1A was normalized to total ULK1:TUBA1A (mean ± SEM; starvation data are analyzed by a one-way ANOVA with Dunnett’s post hoc test; torin1 data are analyzed by a t-test; n = 3 independent experiments, 3–6 DIV). (A-D) GAPDH and TUBA1A/α-tubulin serve as loading controls; horizontal lines designate individual blots. Baf A1, bafilomycin A1; GM, glial media.