
Figure 5.
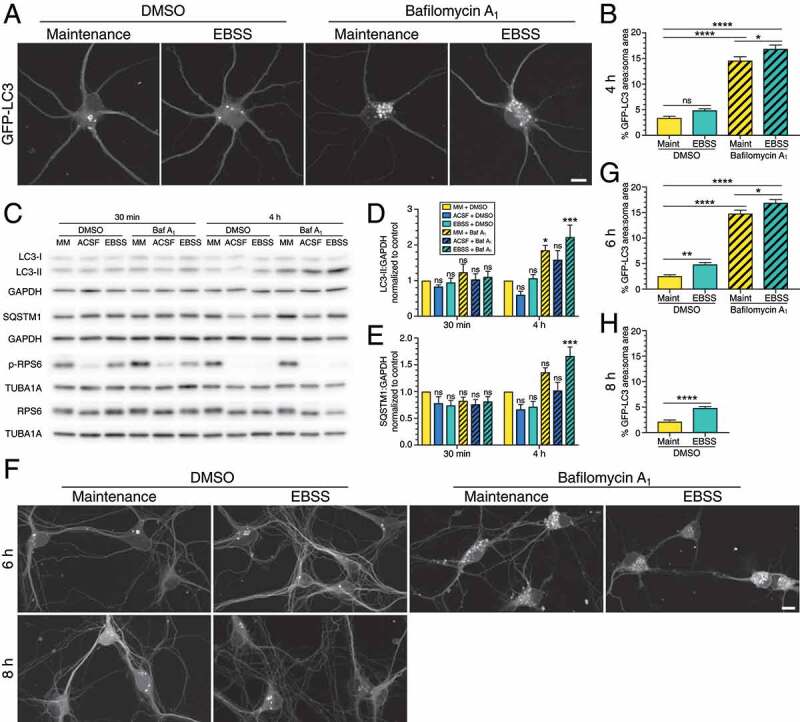
Starvation in EBSS does not robustly activate autophagy in primary neurons. (A) Maximum projections of z-stacks in the soma of GFP-LC3 transgenic hippocampal neurons starved in EBSS for 4 h. Bar: 10 µm. (B) Corresponding quantification of GFP-LC3 puncta area normalized to the soma area of neurons starved in EBSS for 4 h (mean ± SEM; one-way ANOVA with Tukey’s post hoc test; n = 49–71 neurons from 4 independent experiments, 8–10 DIV). (C-E) Immunoblot analysis and corresponding quantification of wild type hippocampal neurons starved in ACSF versus EBSS for 4 h. GAPDH and TUBA1A/α-tubulin serve as loading controls; horizontal lines designate individual blots. LC3-II and SQSTM1 levels were normalized to GAPDH (mean ± SEM; one-way ANOVA with Dunnett’s post hoc test; statistical tests were performed independently for each time point; n = 6 independent experiments, 8–10 DIV). (F) Maximum projections of z-stacks in the soma of GFP-LC3 transgenic hippocampal neurons starved in EBSS for 6 h and 8 h. Bar: 10 µm. (G) Quantification of GFP-LC3 puncta area normalized to the soma area of hippocampal neurons starved in EBSS for 6 h (mean ± SEM; one-way ANOVA with Tukey’s post hoc test; n = 34–64 neurons from 4 independent experiments, 8–9 DIV). (H) Quantification of GFP-LC3 puncta area normalized to the soma area of hippocampal neurons starved in EBSS for 8 h (mean ± SEM; student’s t-test; n = 46–68 neurons from 4 independent experiments, 8–9 DIV). Baf A1, bafilomycin A1; MM, maintenance media.