
Figure 1.
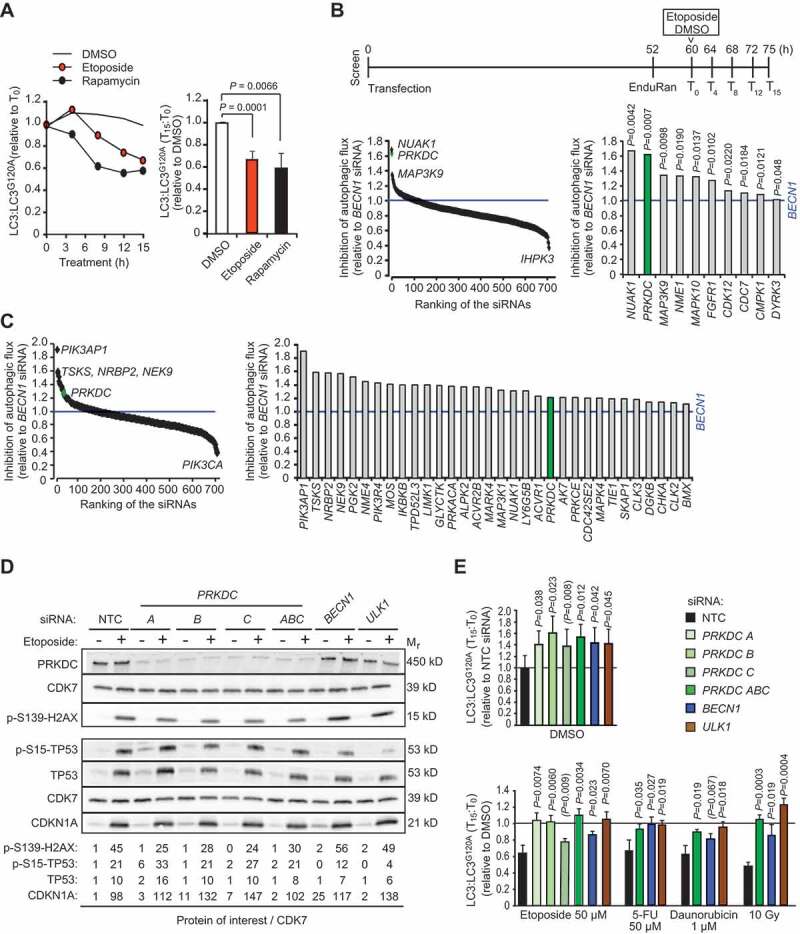
siRNA screens for kinases that regulate basal and etoposide-induced autophagy. (A) MCF7-RLuc-LC3 and MCF-RLuc-LC3G120A cells were treated in parallel with vehicle (DMSO), 50 µM etoposide or 10 nM rapamycin (positive control) for 15 h. Left, kinetics of autophagic flux (reduction of LC3/LC3G120A relative to T0) in one representative experiment. Right, mean ratios +SD of (LC3/LC3G120A at T15):(LC3/LC3G120A at T0) of three independent triplicate experiments. (B and C) MCF7-RLuc-LC3 and – LC3G120A cells transfected with siRNA pools targeting 710 human kinases, BECN1 siRNA (positive control) or non-targeting control siRNA (NTC) were treated in triplicate with 50 µM etoposide (B) or DMSO (C) for 15 h and analyzed for autophagic flux (reduction of LC3/LC3G120A) as outlined in the timeline (B, top). Ranking of all siRNAs (left) and siRNAs with statistically significantly stronger effect than BECN1 siRNA (right) are shown. (D) Representative immunoblots of indicated DNA damage response proteins in lysates of MCF7 cell transfected with indicated siRNAs for 75 h and treated with DMSO (-) or 50 µM etoposide (+) for the last 15 h. CDK7 served as a loading control. Values, densitometric quantifications of indicated protein/CDK7 ratios relative to control samples. <, unspecific ULK1-independent band. (E) MCF7-RLuc-LC3 and – LC3G120A cells were transfected with indicated siRNAs, treated as indicated for 15 h and analyzed for autophagic flux as in (b). Values represent means +SD of ≥ 3 independent triplicate experiments. P-values were calculated by 2-tailed, homoscedastic student’s t-test (a, c and e) or by a linear regression model and Wald test of autophagy inhibition over time (b).