Figure 6.

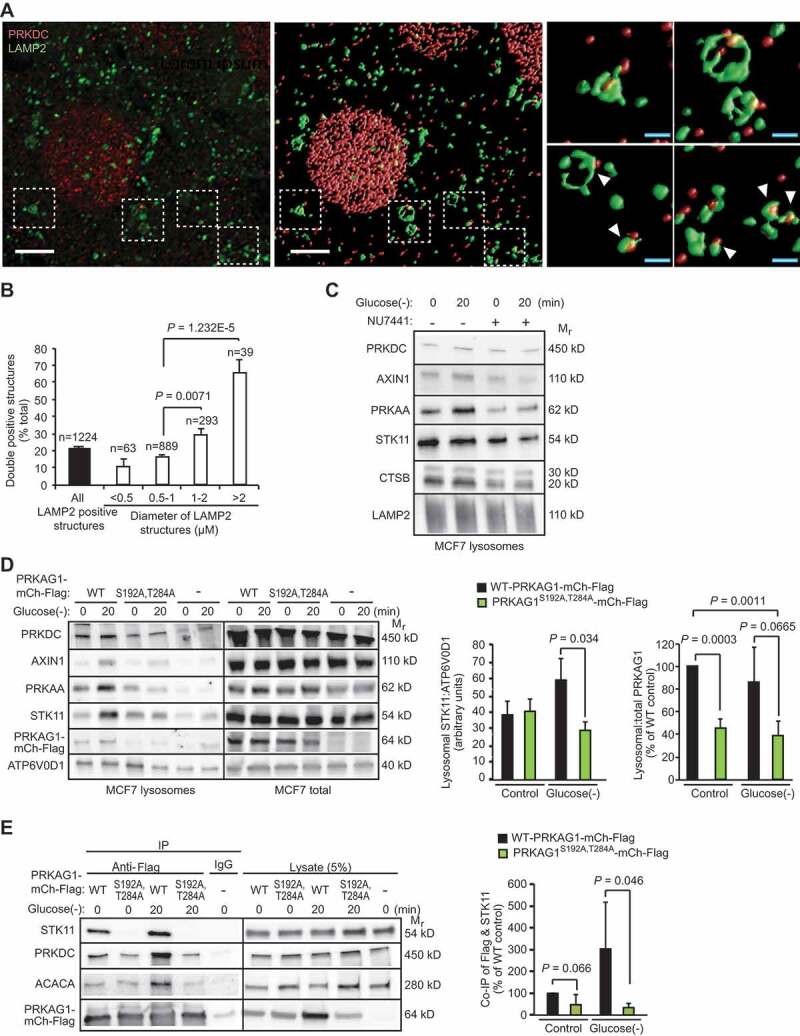
PRKDC regulates the lysosomal localization and STK11 association of the AMPK complex. (A) Representative laser scanning confocal images of MCF7 cells fixed with methanol and stained for PRKDC and LAMP2. A representative cross-sectional image (z: 100nm) (left) and surface-rendered de-convoluted z-stacks (middle and right) are shown. Insets show representative PRKDC- and LAMP2-positive structures marked with white arrowheads (right). Scale bars, 5 µm (white) and 1 µm (blue). (B) Percentage of PRKDC- and LAMP2-double positive structures of all LAMP2-positive structures in MCF7 cells visualized as in (a). Values represent means + SEM of 12 randomly chosen cells with a total of 1224 LAMP2-positve structures analyzed. (C) Representative immunoblots of indicated proteins from lysosomes purified from MCF7 cells starved for glucose for indicated times. When indicated (+), cells were pre-treated with 1 µM NU7441 for 16 h. (D) Representative immunoblots of indicated proteins from lysosomes and total cell lysates of MCF7 cells transiently transfected with WT PRKAG1S192A,T284A-mCherry-Flag or an empty vector (-) and starved for glucose for indicated times (left), and densitometry quantification of STK11/ATP6V0D1 and lysosomal/total PRKAG1-mCherry-Flag ratios in lysosome samples (right). Error bars, SD of ≥ 3 independent experiments. (E) IP of AMPK complexes with anti-Flag antibodies from lysates of MCF7 cells transiently transfected with either WT or PRKAG1S192A,T284A-mCherry-Flag and starved for glucose for indicated times (left), and densitometric quantification of STK11 in anti-Flag IPs (right). Error bars, SD of ≥ 3 independent experiments. P-values were calculated by 2-tailed, homoscedastic student’s t-test.
