
Figure 4.
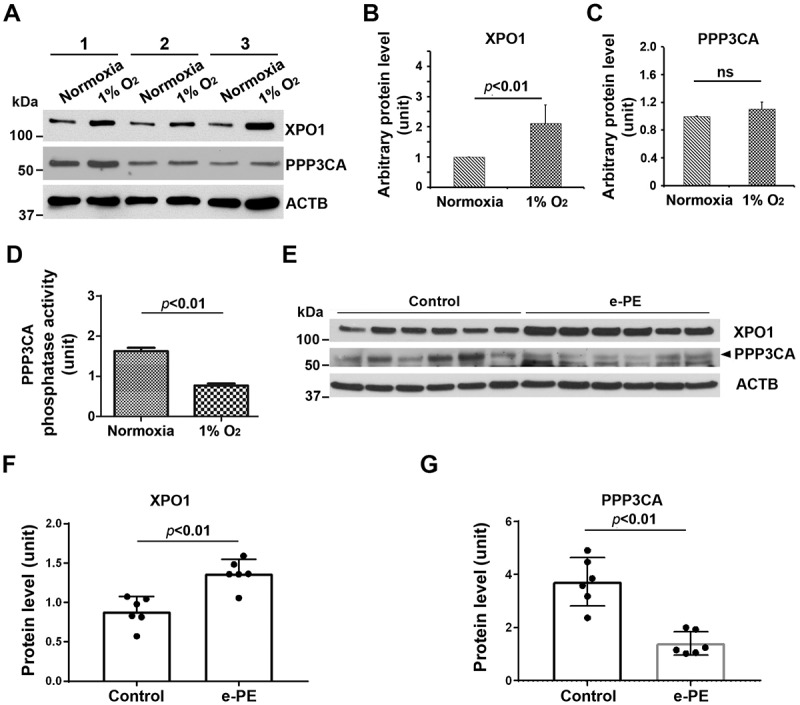
Analysis of XPO1 and PPP3/calcineurin in normoxia/hypoxia-exposed primary human trophoblasts and the placenta from e-PE vs. controls. (A–C) The expression of XPO1 and PPP3 in cells with indicated treatment was evaluated using western blotting in A and statistically analyzed in B and C. (D) The phosphatase activity of PPP3/calcineurin was assessed and compared between hypoxia- and normoxia-treated cells. (E–G) Protein abundance of XPO1 and PPP3 was detected using western blotting (E) and statistically analyzed (F and G) in the placenta from e-PE and gestational age-matched deliveries.