Figure 6.

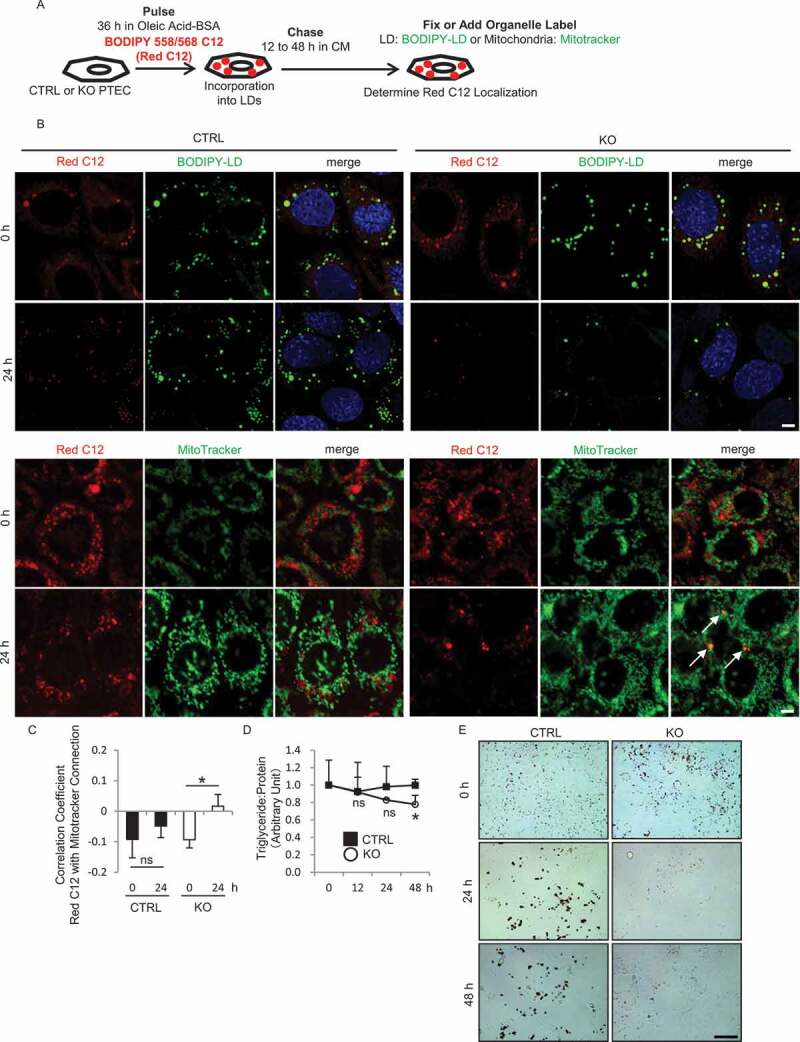
RUBCN deficiency promotes LD degradation in cultured PTECs. (A) Schematic representation of the FA pulse-chase assay. PTECs were incubated with CM containing 1 μM Red C12 and 250 μM OA for 36 h, and then chased for the indicated times. (B) Representative images of fluorescence analysis for BODIPY-LD (green) or MitoTracker Deep Red (green) and DAPI (blue) as counterstaining in chased CTRL and KO PTECs at 0 and 24 h. (C) Colocalization of Red C12 and MitoTracker Deep Red in (B) was assessed by the Pearson correlation coefficient. (D) The ratio of TG levels to protein in chased CTRL and KO PTECs was analyzed. (E) Representative images of ORO staining in chased CTRL and KO PTECs. n = 3 in each group. Data are provided as the mean ± SD. ns, not significant. Statistically significant differences (*P < 0.05) are indicated. Bars: 5 µm (B) and 200 µm (E).
