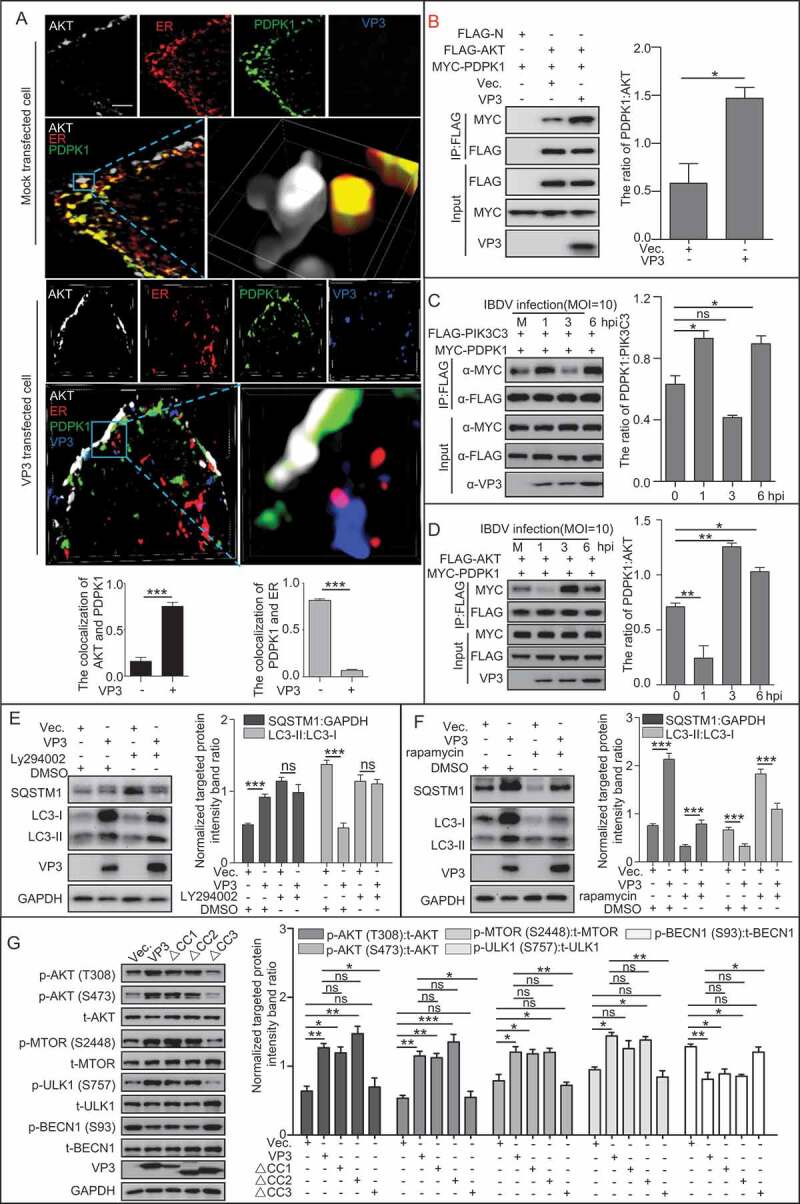
Figure 6.

VP3 enhances the interaction between AKT and PDPK1 and the phosphorylation of AKT and MTOR. (A) Three-dimensional image analysis of the colocalization between PDPK1, AKT, the ER, and VP3 using a super resolution microscope. HEK293T cells were transiently co-transfected with four vectors DsRed-ER, GFP-PDPK1, FLAG-AKT, and pCI-neo-VP3 or empty vector pCI-neo for 24 h. The cells were then immunostained with anti-FLAG and anti-VP3 mAbs and observed under a structured illumination microscope. Scale bar: 1 μm. (B) VP3 expression promoted interaction between PDPK1 and AKT. HEK293T cells were transiently co-transfected with vectors expressing FLAG-AKT, MYC-PDPK1, and pCI-neo-VP3 or empty vector pCI-neo for 48 h. The cell lysates were subjected to anti-FLAG IP and immunoblotting analysis of AKT, PDPK1, and VP3 using the indicated antibodies. (C) PIK3C3 binding to PDPK1 was decreased at 3 h post-infection. HEK293T cells were co-transfected with FLAG-PIK3C3 and MYC-PDPK1 for 24 h. The resultant cells were then infected with Avibirnavirus at MOI = 10 for 0, 1, 3, and 6 h and subjected to IP and immunoblotting assays with the indicated antibodies. (D) PDPK1 binding to AKT was enhanced at 3 h post-infection. The HEK293T cells were co-transfected with FLAG-AKT and MYC-PDPK1 for 24 h. The resultant cells were then infected with Avibirnavirus at MOI = 10 for 0, 1, 3, and 6 h and subjected to IP and immunoblotting assays using the indicated antibodies. (E and F) HEK293T cells were transiently transfected with VP3 and vector. After 20 h, the cells were separately treated with DMSO, LY294002 (10 μg/ml), or rapamycin (5 μM) for 4 h. Immunoassays of extracts of HEK293T cells were then performed using the indicated antibodies. (G) CC3 domain is required for VP3 mediating activation of AKT-MTOR pathway. HEK293T cells were transfected with VP3, VP3∆CC1, VP3∆CC2, VP3∆CC3, and vector, respectively. At 20 h post-transfection, HEK293T cells were starved for 4 h. The cellular extracts were then subjected to immunoblotting assay using the indicated antibodies. Error bars: Mean ± SD of 3 independent tests. One-way ANOVA; *p < 0.05; **p < 0.01; ***p < 0.001 compared to control.
