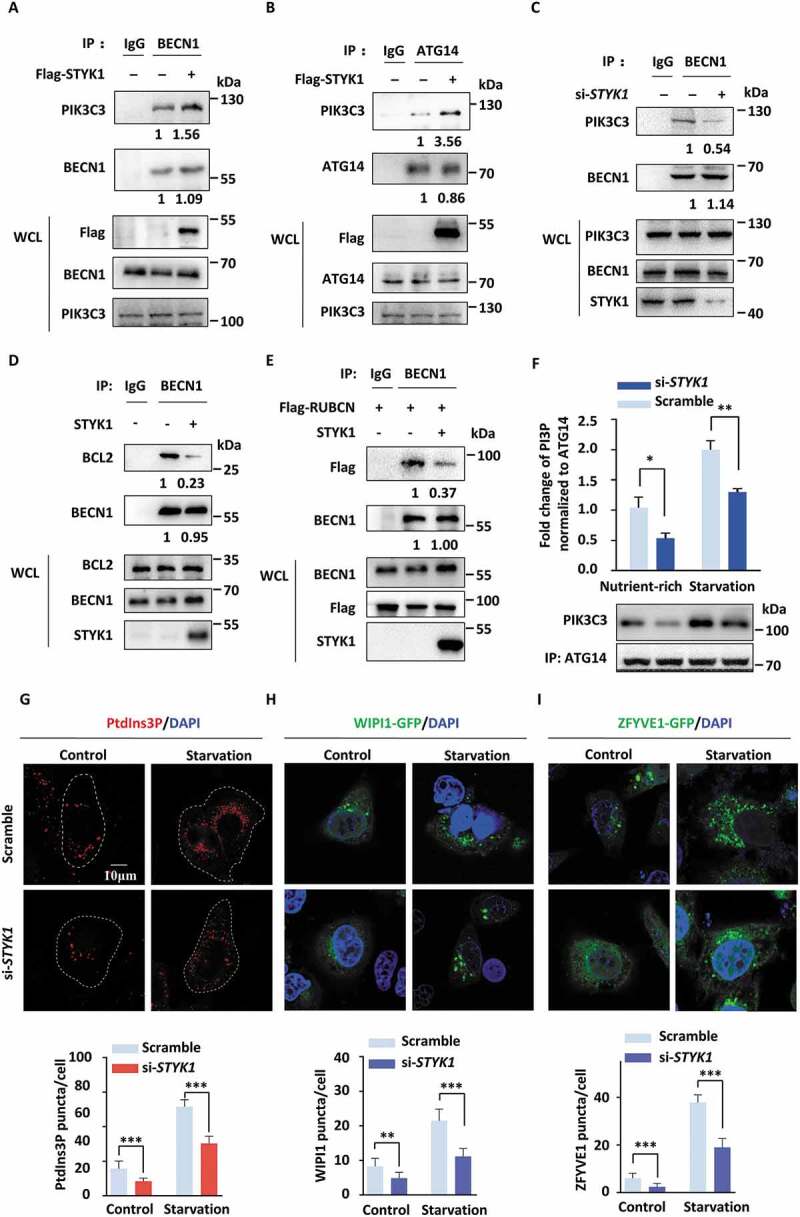
Figure 5.

STYK1 promotes the assembly of the PtdIns3K-C1 complex. (A-B) The exogenously expressed Flag-STYK1 enhanced BECN1-PIK3C3 and ATG14-PIK3C3 interactions in HeLa cells. The immunoprecipitated endogenous PIK3C3 was quantified using Image lab software and normalized against the amount of PIK3C3 in the whole-cell lysates (WCL). (C) STYK1 knockdown inhibits the interaction between endogenous BECN1 and HA-PIK3C3. The immunoprecipitated PIK3C3 was quantified and normalized against the amount of PIK3C3 in WCL. (D) The exogenously expressed nontagged STYK1 inhibits the interaction between BECN1 and BCL2. The immunoprecipitated BCL2 was quantified and normalized against the amount of BCL2 in WCL. (E) The exogenously expressed nontagged STYK1 inhibits the interaction between BECN1 and Flag-RUBCN. The immunoprecipitated Flag-RUBCN was quantified and normalized against the amount of Flag-RUBCN in WCL. (F) Different PtdIns3K-C1 complex components from the control or STYK1 knockdown HeLa cells were immunoprecipitated by the ATG14 antibody under either nutrient-rich or starvation conditions. PIK3C3 activity was measured by analyzing PtdIns3P production using the ELISA assay described in the Materials and Methods. The PtdIns3P fold change was calculated based on the concentration of PtdIns3P and was normalized to the amount of ATG14 used in the assay. (G-I) Confocal microscopy of either the nutrient-rich or the starvation-induced (EBSS 2 h) PtdIns3P puncta (G), WIPI1-GFP puncta (H), and ZFYVE1-GFP puncta (I) in the control and STYK1 knockdown HeLa cells. The numbers of PtdIns3P, ZFYVE1-GFP and WIPI1-GFP puncta was quantified (n = 10). Scale bars: 10 µm. *P < 0.05; **P < 0.01; ***P < 0.001. Data are presented as mean ± SD.
