
Figure 5.
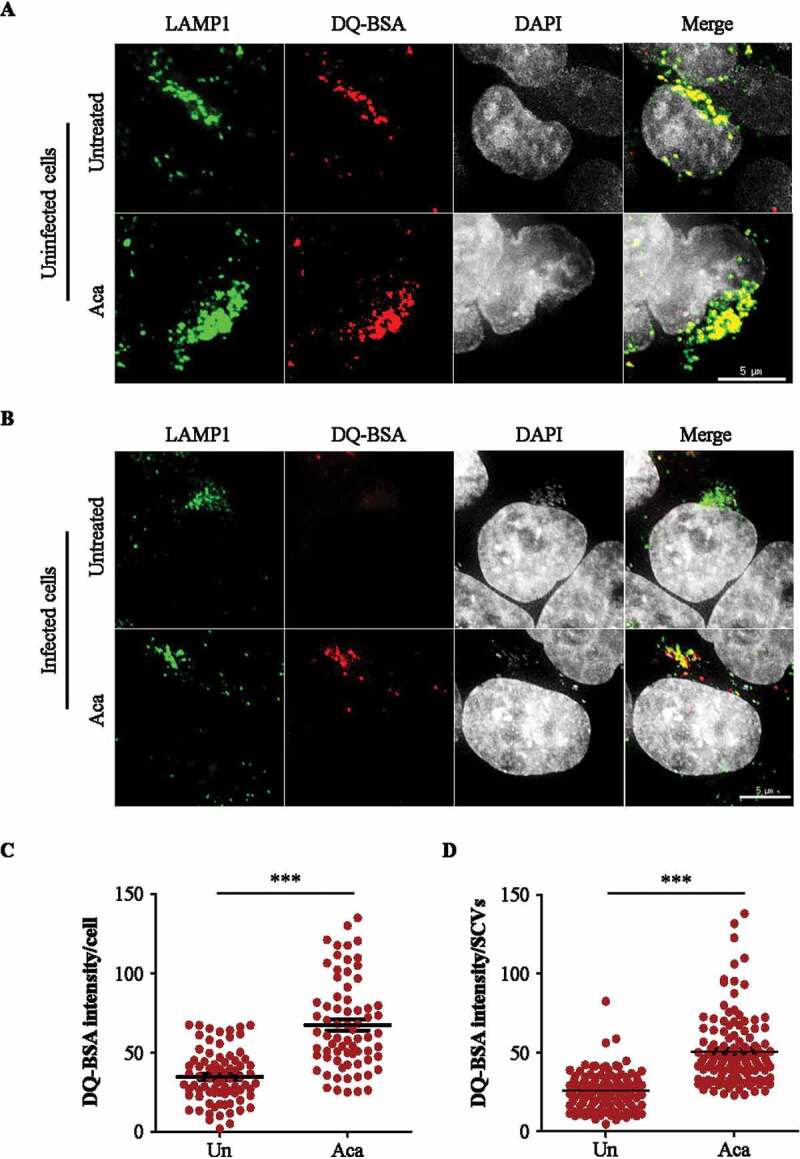
Acacetin treatment increases the proteolytic activity of Salmonella-containing vacuoles. (A) Representative microscopy images of HeLa cells treated with DQ-BSA for 2 h followed by 4 h incubation of DQ-BSA along with acacetin treatment. Cells were immunostained for LAMP1 (n = 25, N = 3). Scale bar: 5 µm. (B) Representative microscopy images of mCherry S. typhimurium infected HeLa cells treated with DQ-BSA for 2 h followed by 4 h incubation of DQ-BSA along with acacetin treatment. Cells were immunostained for LAMP1. Scale bar: 5 µm. (C and D) The differences in DQ-BSA intensity per cell or SCVs induced by acacetin treatment were quantified (n = 25, N = 3). Quantification of microscopy images were performed on projected images. Statistical analyses on three independent experiments were performed using unpaired student’s two-tailed t-test; ns- non-significant, *p < 0.05, **p < 0.01, ***p < 0.001. Error bars represent mean ± SEM.