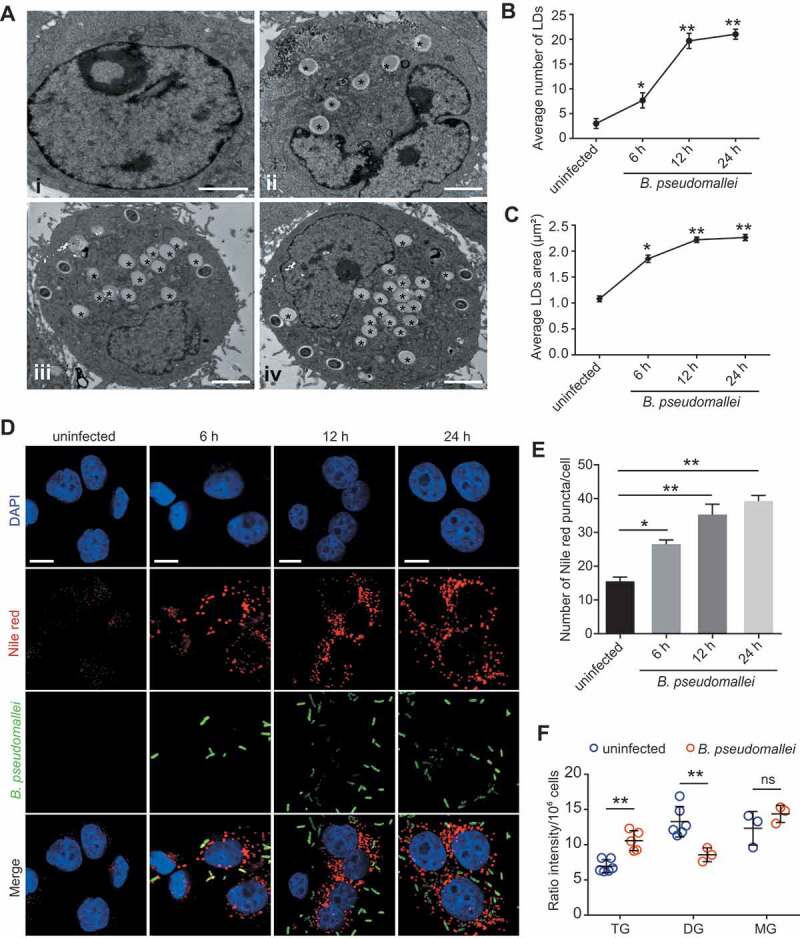
Figure 1.

Lipid droplets accumulation in response to B. pseudomallei in A549 cells. (A) Representative TEM images of lipid droplets in A549 cells. A549 cells were uninfected (I) or treated with B. pseudomallei (MOI = 10) for 6 h (ii), 12 h (iii) and 24 h (iv). * indicates lipid droplets. Scale bars: 2 μm. (B and C) Quantification of the number and area of LDs per cell in TEM images. LDs, lipid droplets. (D and E) Lipid staining of B. pseudomallei infected A549 cells by Nile red as described above. Representative images are displayed. The number of lipid droplet puncta in each cell was counted. Scale bars: 10 μm. (F) Measurement of cellular lipid levels in control or B. pseudomallei-infected A549 cells by LC-MS/MS analysis. A549 cells were uninfected or B. pseudomallei-infected (MOI = 10) for 12 h. Data is shown as the mean ± SD of three independent experiments. *P < 0.05, **P < 0.01. ns, not significant
