Figure 2.

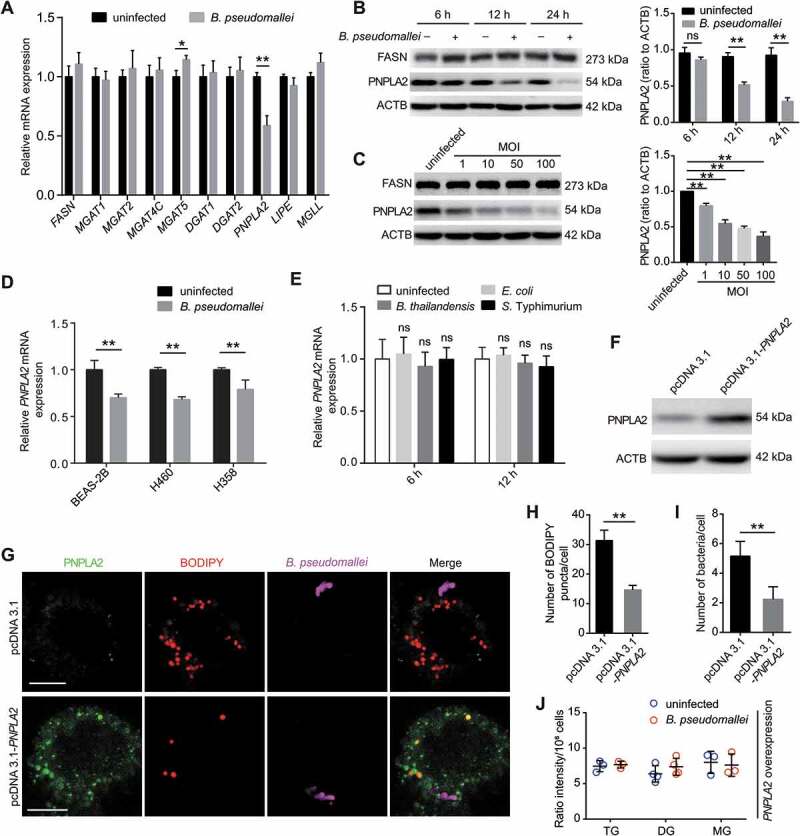
Inhibition of PNPLA2 contributes to lipid accumulation after B. pseudomallei infection. (A) Expression of lipid metabolism-related genes in A549 cells infected with B. pseudomallei (MOI = 10) for 12 h. The mRNA levels of FASN, MGAT1, MGAT2, MGAT4C, MGAT5, DGAT1, DGAT2, PNPLA2, LIPE and MGLL were measured by qRT-PCR. (B and C) Western blot analysis of PNPLA2 and FASN in A549 cells after B. pseudomallei infection (MOI = 10) for 6, 12 and 24 h or at indicated MOIs (1, 10, 50, 100) for 12 h. Densitometric analyses were performed to quantitate the fraction of PNPLA2 of at least three independent experiments. (D) qRT-PCR analysis of PNPLA2 expression in BEAS-2B, H460 and H358 cells after treated with B. pseudomallei (MOI = 10) for 12 h. (E) Measurement of PNPLA2 expression by qRT-PCR in A549 cells after infected with B. thailandensis, S. Typhimurium and E. coli (MOI = 10) for 12 h, respectively. (F) The protein level of PNPLA2 was determined by western blot. A549 cells were transfected with the pcDNA3.1 or pcDNA3.1-PNPLA2 for 24 h. (G) Lipid droplets were detected by confocal microscopy. A549 cells were transfected with pcDNA3.1 or pcDNA3.1-PNPLA2 for 24 h, and then infected with B. pseudomallei (MOI = 10) for 12 h. Scale bars: 10 μm. (H and I) The numbers of lipid droplet puncta and B. pseudomallei in each cell were counted. Lipid droplets were staining by BODIPY (red). (J) Cellular lipid levels were detected by LC-MS/MS analysis. A549 cells were transfected with pcDNA3.1-PNPLA2 plasmids for 24 h, then uninfected or B. pseudomallei-infected (MOI = 10) for 12 h. This experiment was repeated at least three times. *P < 0.05, **P < 0.01. ns, not significant
