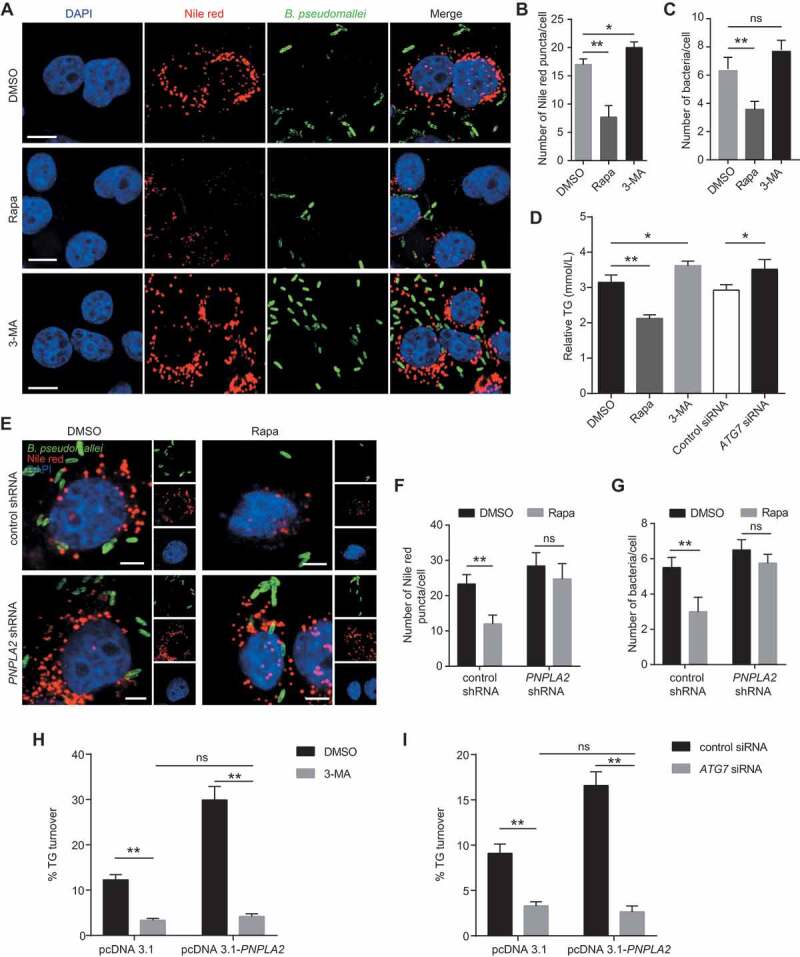
Figure 3.

PNPLA2 and lipophagy regulate the lipid accumulation during B. pseudomallei infection. (A) Representative images show the number of lipid droplets in A549 cells infected with B. pseudomallei (MOI = 10) for 12 h in the presence of Rapa (200 nM) or 3-MA (10 mM). Scale bars: 10 μm. (B and C) ImageJ quantification of the numbers of lipid droplets and B. pseudomallei per cell in above confocal images. (D) Lipophagy is involved in the regulation of TG in A549 cells. After pretreatment by DMSO, Rapa and 3-MA, or transfected with ATG7 siRNA (100 nM), cells were infected with B. pseudomallei (MOI = 10) for 12 h. (E) Lipid droplet was visualized by immunostaining in A549 cells. After transfected with control or PNPLA2 shRNA (1 μg), cells were infected with B. pseudomallei (MOI = 10) for 12 h in the presence of DMSO or Rapa (200 nM). Scale bars: 5 μm. (F and G) Quantification of the numbers of Nile red puncta and B. pseudomalle in each cell. (H and I) Measurement of TG turnover in A549 cells. After transfected with the pcDNA3.1 or pcDNA3.1-PNPLA2, cells were treated with 3-MA or ATG7 siRNA and then infected with B. pseudomallei for 12 h. Experiments performed in triplicate showed consistent results. *P < 0.05, **P < 0.01. ns, not significant
