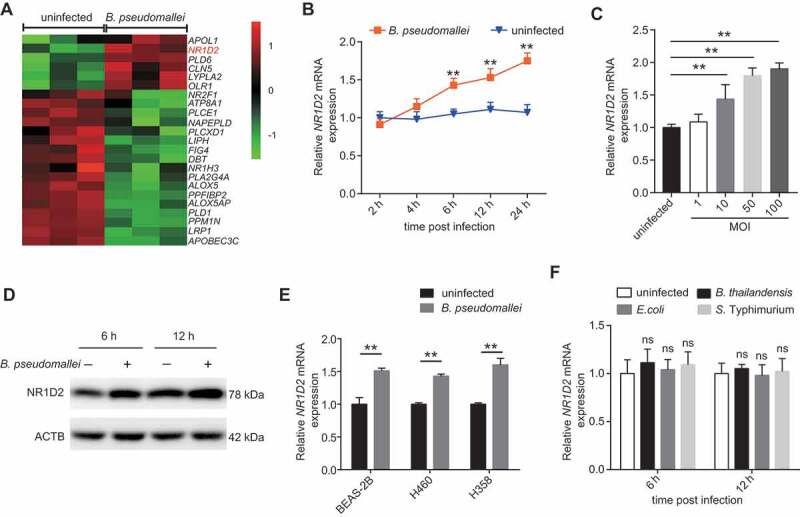
Figure 5.

Upregulation of NR1D2 expression during B. pseudomallei infection. (A) Cluster analysis of mRNA expression profiles identified a group of altered lipid metabolism-related genes. (B and C) Confirmation of microarray results by qRT-PCR. qRT-PCR analysis of NR1D2 expression levels in A549 cells after infected with B. pseudomallei for the indicated time points (MOI = 10) or the MOIs (6 h p.i.). (D) Western blot analysis of NR1D2 protein levels in uninfected and B. pseudomallei-infected A549 cells for 6 and 12 h (MOI = 10). (E) The expression of NR1D2 in BEAS-2B, H460 and H358 cells after infected with B. pseudomallei (MOI = 10) for 6 h. (F) Expression of NR1D2 in A549 cells infected with B. thailandensis, E. coli and S. Typhimurium (MOI = 10) for 6 h. Data represent mean ± SD for at least 3 separate experiments. **P < 0.01. ns, not significant
