Figure 7.

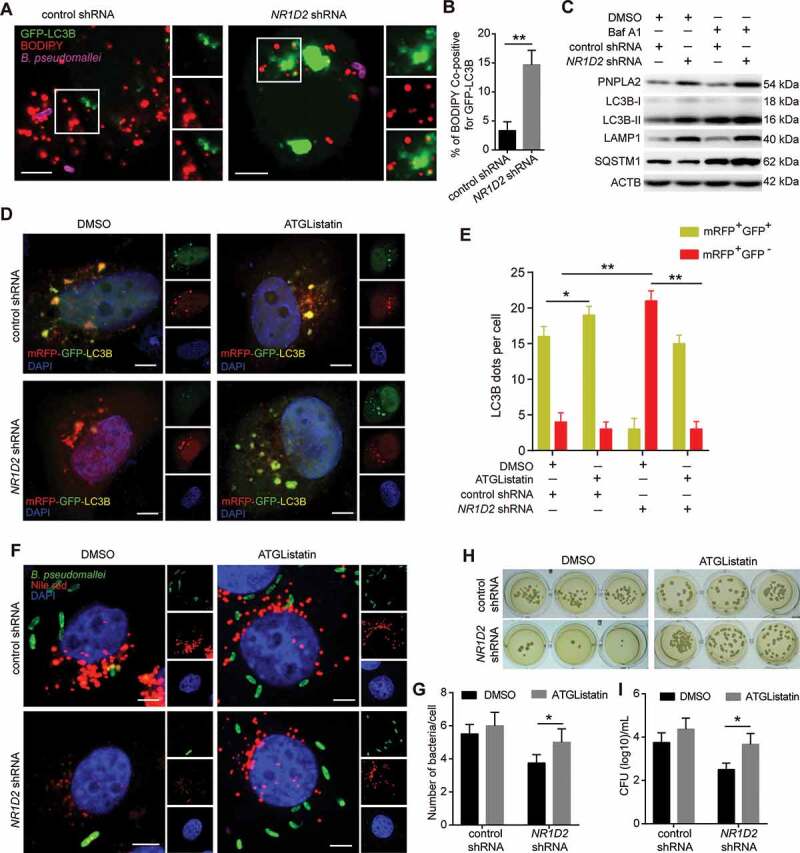
NR1D2 is required for PNPLA2-mediated effects on autophagic flux and regulation of B. pseudomallei infection. (A and B) Representative images of lipid droplet and GFP-LC3B puncta in A549 cells. After transfected with the control and NR1D2 shRNA, A549 cells were treated with GFP-LC3B and then infected with B. pseudomallei (MOI = 10) for 12 h. Quantitative analysis of the colocalization of BODIPY and GFP-LC3B. Scale bars: 5 μm. (C) The autophagic flux was detected by western blot. A549 cells were transiently transfected with the control and NR1D2 shRNA for 24 h, and then infected with B. pseudomallei (MOI = 10) for 12 h in the presence of DMSO or Baf A1 (10 nM). (D and E) A549 cells transiently expressing mRFP-GFP-LC3B were transfected with control or NR1D2 shRNA, and then treated with the DMSO or ATGListatin (30 μM) for 24 h and infected with B. pseudomallei (MOI = 10) for 12 h. The graph shows the quantification of mRFP+GFP+ or mRFP+GFP− by taking the average number of puncta per cell. Scale bars: 5 μm. (F and G) Representative images were visualized by confocal. After transfected with control or NR1D2 shRNA, A549 cells were treated with the DMSO or ATGListatin (30 μM) for 24 h and infected with B. pseudomallei (MOI = 10) for 12 h. Quantification shows the number of B. pseudomallei in each cell. Scale bar: 5 μm. (H and I) Intracellular growth of B. pseudomallei was detected by CFU assay. A549 cells were treated as described above. Data is shown as the mean ± SD of three independent experiments. *P < 0.05, **P < 0.01
