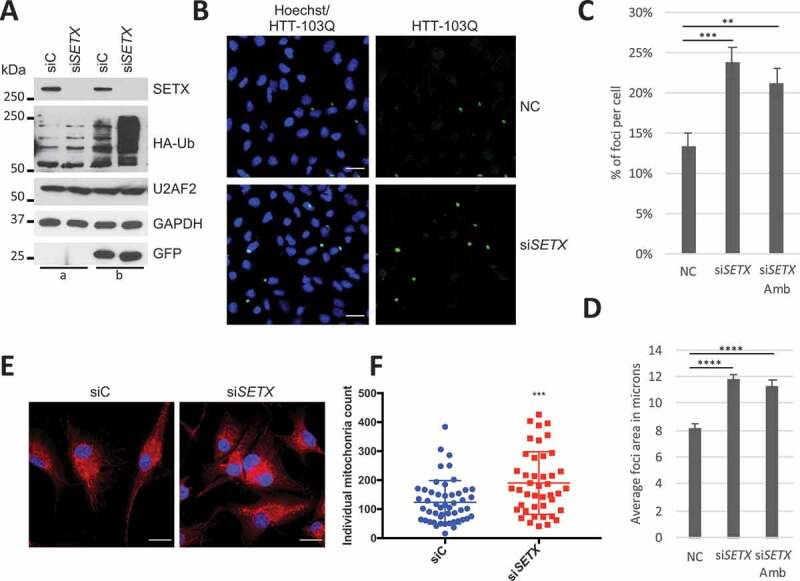
Figure 7.

SETX depletion affects proteins and organelles clearance. (A) Ubiquitinated proteins accumulate after SETX KD. U87 cells were transfected with control (siC) and siSETX for 72 h without (a) or with (B) HA-Ub (4 μg) and a GFP (200 ng) plasmids (as transfection control) for 48 h. GAPDH and U2AF2 are used as loading controls. (B) IF of HTT-103Q-CFP in UC7 cells after 3 d of siRNA control (NC) and siSETX (KD). Scale bar: 25 µm. (C) Quantification of foci number in control cells (NC) and cells transfected with 2 different siRNA targeting SETX (siSETX and siSETX Amb). Cells count for NC = 1831, siSETX = 1843, siSETX Amb = 1803. SE shown. Significance was analyzed by a student’s t-test, **p < 0.01, ***p < 0.001. (D) Measurement of foci size in experiments as described in B. Area threshold: between 1 and 58 microns. Foci count for NC = 503, siSETX = 543, siSETX Amb = 522. n = 2, SE shown. Significance was analyzed by a student’s t-test, ****p < 0.0001. (E) U87 cells KD with siC and siSETX for 3 d and labeled with MitoTracker M7512. Scale bar: 25 µm. (F) Plot quantitating mitochondria using images as in (E). Each dot (blue or red) represents the number of mitochondria in that cell, with ~ 50 cells quantitated for each condition. Middle bar represents median with error bars representing standard deviation (SD). ***p ≤ 0.001. Significance was assessed via unpaired t-test
