. 2021 Jul 26;12(33):11121–11129. doi: 10.1039/d1sc03050g

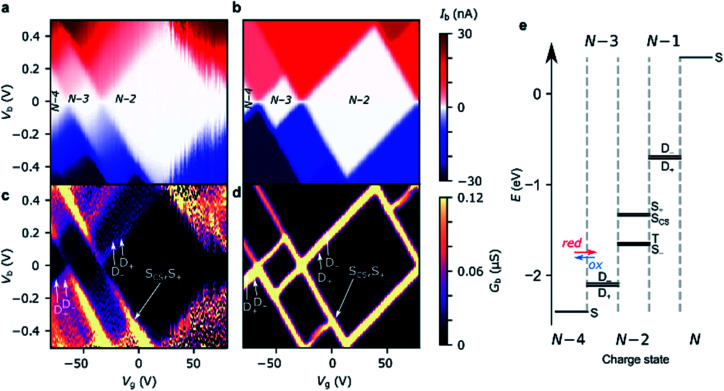
Fig. 3. Experimental stability diagrams of device A, (a) current and (c) derived conductance, measured at 77 K; the Coulomb diamonds are assigned with their charge states. (b) and (d) are current and conductance stability diagrams, respectively, calculated using the Hubbard model, with parameters U = 0.50 eV, V = 0.14 eV and t = −0.01 eV. The couplings to the source and gate electrodes are αS = 0.37, and αG = 4.8 × 10⁻³, taken from the experimental data. The molecule–electrode couplings are taken from the IV fit in Fig. 4a. (e) The energy eigenvalues of the 16 Fock states of FP3 involved in electron transfer calculated for device A using the Hubbard model at Vg = −80 V, the lowest experimental gate voltage. The potentials experienced by the molecule are much lower than those applied experimentally due to screening by the 300 nm SiO2 gate dielectric, this is captured by the small value of αG.

Fig. 3