. 2021 Jul 26;12(33):11121–11129. doi: 10.1039/d1sc03050g

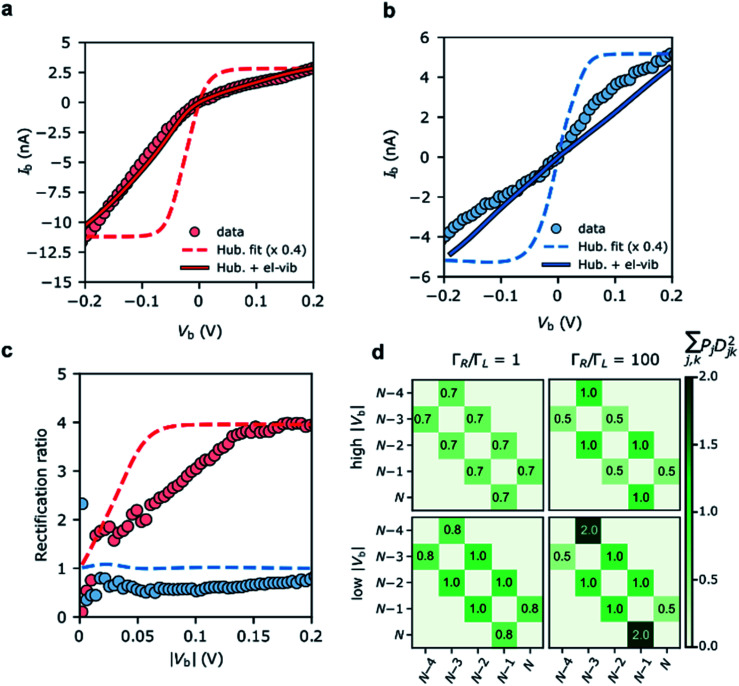
Fig. 4. Device AIV traces on (a) the N − 4/N − 3 resonance (Vg = −66 V), and (b) the N − 3/N − 2 resonance (Vg = −34 V). The experimental data are plotted alongside IV traces taken from the Hubbard stability diagrams in Fig. 3, and the Hubbard model plus electron–vibration coupling included in the electron-transfer rates. Electron–vibration fitting parameters for N − 4/N − 3: ΓL = 41 μeV, ΓR = 14 meV, λ0 = 70 meV; for N − 3/N − 2, λ0 = 120 meV. (c) The rectification behaviour, Ib(−Vb):Ib(+Vb), of the N − 4/N − 3 (red) and N − 3/N − 2 (blue) transitions are given for the experimental values (circles) and the Hubbard model (dashed lines). The measurements were taken at a device temperature of 77 K. (d) The emergence of the rectification behaviour of the Hubbard model under asymmetric molecule–electrode coupling. Each element (j,k) represents the sum of the electron transfer rates from charge state j to k. ‘High’ |Vb| means above 2|t|/αS, when both N − 3 doublets are within the bias window. An improved fit to N − 3/N − 2 (maintaining the rectification ratio) can be achieved by going beyond the wide-band gap approximation, see ESI..

Fig. 4