. 2021 Jul 2;12(33):10990–11003. doi: 10.1039/d1sc00749a

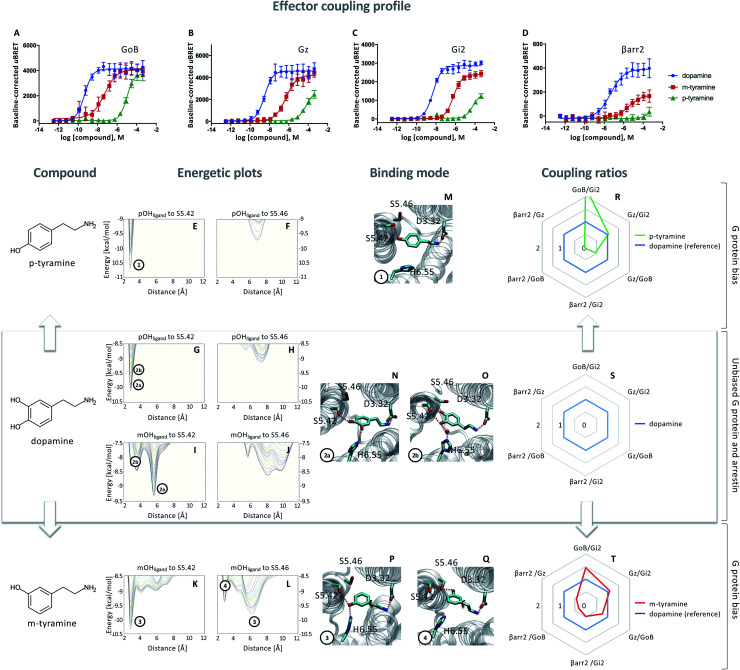
Fig. 1. Coupling and binding profile of dopamine, p-tyramine and m-tyramine. The corresponding chemical structures are depicted on the left. (A–D) Concentration–response curves of dopamine (blue), p-tyramine (green) and m-tyramine (red)-induced coupling to GoB, Gz, Gi2 and β-arrestin 2 (βarr2) at the D2R. For corresponding pEC50 and Emax values see Table S3. (E–L) Energetic plots of ligand binding obtained by metadynamics using as metrics the distance of the m- and/or p-OH groups to S5.42 and S5.46. An energetic well at ∼2.8 Å indicates a favorable distance for binding contacts with the corresponding residue. To ensure convergence of binding energetics, we monitored free energy profiles along simulation by plotting the profile every 20 000 deposited Gaussian (graphs shown in different colors). (M–Q) Representative structures of the binding mode corresponding to the energetic wells identified in the energetic plots. (R–T) Coupling ratios were approximated using the area under the curve (AUC) and its ratios for individual signaling effectors (e.g. βarr2 vs. Gz, βarr2 vs. GoBetc.). To eliminate observational bias linked to differences within different biosensor assays (e.g. βarr2 vs. Gi), we use dopamine as an internal standard for analyzing the AUCs. The coupling profile of the reference compound dopamine is denoted by a coupling ratio of 1 for all pathway combinations and highlighted in all plots as a blue line. Preferential or disfavored coupling (vs. dopamine) are indicated by ratios > 1 or < 1, respectively. Concentration–response curves were generated using data obtained from 3 independent experiments. Baseline uBRET values were subtracted from concentration–response curves.

Fig. 1