. 2021 Jul 22;12(33):11197–11203. doi: 10.1039/d1sc02854e

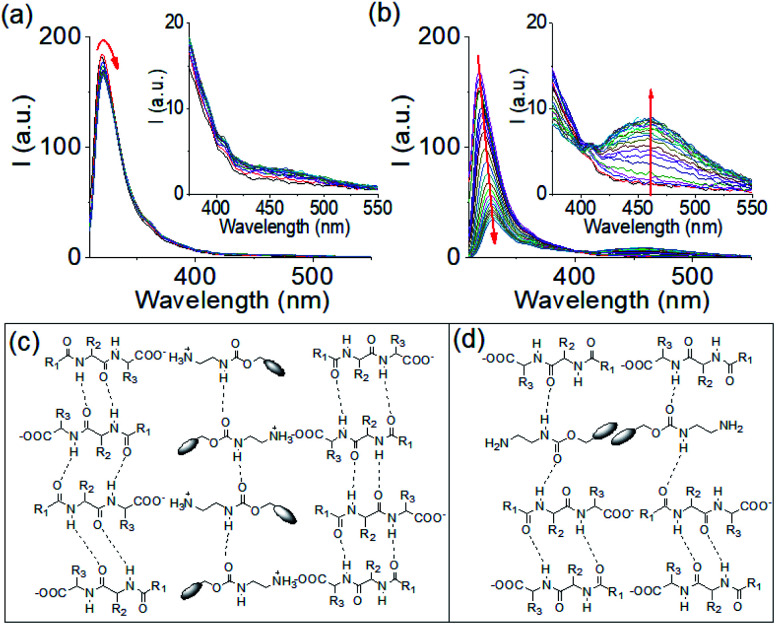
Fig. 2. Time variable emission spectra for the mixture of 1 and 2 in presence of 0.005 M (a) and 0.011 M (b) of NaOH. Insets represent expanded section of the corresponding graph. Time variable data for the gels were recorded after 1 min, 2 min, 5 min, 10 min, 15 min, 30 min, 1 h, 1.5 h, 2 h and then after each hour onward until 16 h of addition of the components. The red arrow shows how the spectrum changes with time. (c and d) Probable modes of interaction between 1 and 2 in the multicomponent gel formed at pH 6.3 (c) and pH 9.9 (d). For (c and d): R1 = PhOCH2, R2 = PhCH2, R3 = Me2CHCH2 and the blob represents the fluorenyl group. For (a and b), initial concentrations of 1 and 2 are 2 mg mL−1, solvent is DMSO/H2O (20/80, v/v).

Fig. 2