. 2021 Jul 22;12(33):11197–11203. doi: 10.1039/d1sc02854e

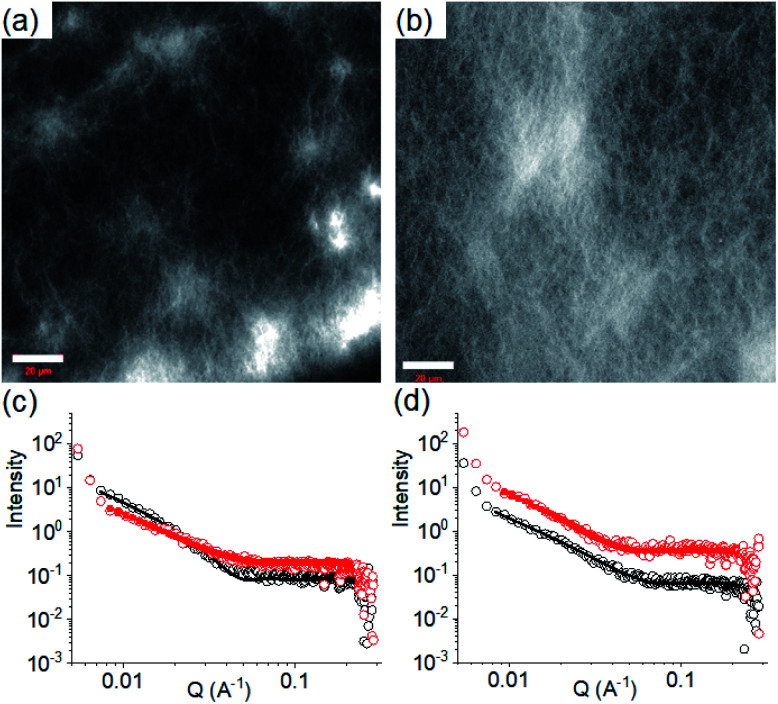
Fig. 3. Confocal fluorescence microscopy images (scale bars represent 20 μm) of the multicomponent gel of 1 and 2 obtained at pH 6.3 (a) and pH 9.9 (b). (c) Shows SAXS data and fits for systems obtained by PAF. (d) Shows SAXS data and fits for systems obtained after a pH cycle. For (c) and (d), the black data are for the multicomponent gels at pH 9.9 and the red data for the multicomponent gels at pH 6.3. The open symbols show the data and the solid lines the fits to the data as discussed in the text. The error bars for the SAXS data are omitted here for clarity but are shown in Fig. S3. In all cases, initial concentrations of 1 and 2 are 2 mg mL−1, solvent is DMSO/H2O (20/80, v/v).

Fig. 3