. 2021 Jul 22;12(33):11197–11203. doi: 10.1039/d1sc02854e

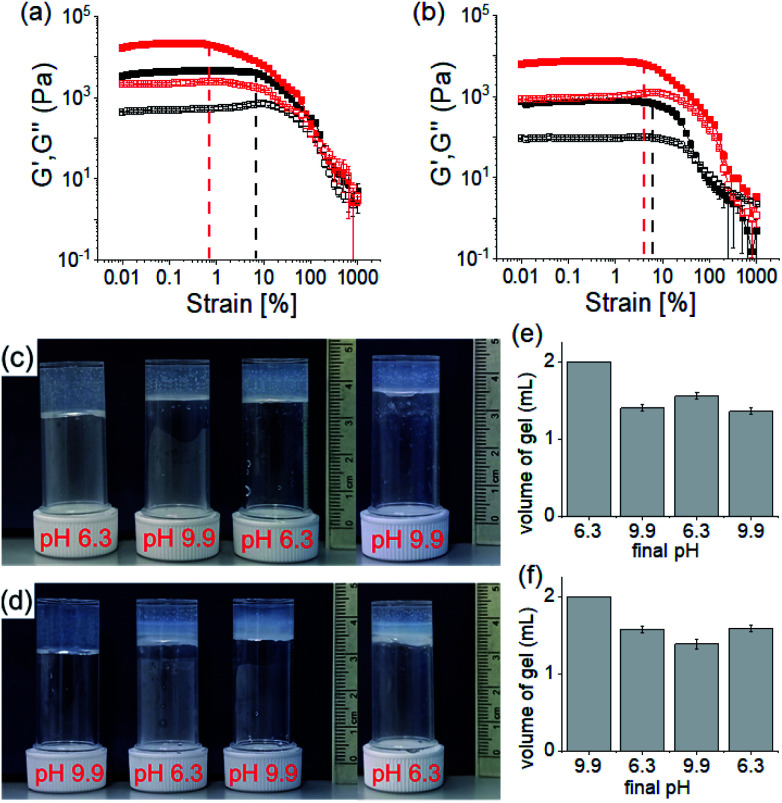
Fig. 5. Strain sweep experiments of the hydrogels of (1 + 2) at pH 6.3 (a) and pH 9.9 (b) prepared directly (black) or by PAF method (red). The closed symbols represent G′, the open symbols G′′. The dotted vertical lines represent the maximum strain bearing capacity of the corresponding hydrogels. (c and d) Photographs showing the changes in gel volume on successive pH change starting from a directly prepared gel at pH 6.3 (c) and 9.9 (d). (e) and (f) are the bar graphs representing the final volume of the respective gels obtained from (c) and (d) respectively. In all cases, initial concentrations of 1 and 2 are 2 mg mL−1, solvent is DMSO/H2O (20/80, v/v).

Fig. 5